
Vol. 37, No. 2, 2022
https://doi.org/10.55667/ijede.2022.v37.i2.1260
Abstract: This case study examined distance education (DE) teachers using remote science inquiry instruction (RSII) to support a hands-on lab for motion on an inclined plane. The actions of the teachers and students as they worked together are reported. The teachers and students used RSII to complete a lesson developed by three teachers as part of an online lesson study (Lewis & Hurd, 2011). During the Study and Plan phases of the lesson study, student preparation was deemed paramount. Students at disparate geographical locations needed to be ready to conduct the hands-on inquiry. The students used Vernier probe ware and interfaces during synchronous instruction, and teacher support via Brightspace. A Google Doc, with hyperlinked Screencastify videos, was developed during the Plan phase to train students in how to use the probe ware required to conduct the inquiry.
During the Teach phase of the lesson study, the teachers used the predict–observe–explain (POE) strategy of inquiry to engage students and elicit samples of student thinking (White & Gunstone, 1992). To predict, the students drew the shape of the graph and explained the reasoning behind their prediction. To observe, the students conducted the inclined plane inquiry and took note of what happened as the motion data was simultaneously collected and graphed. To explain, the students observed the graph and used RSII to engage synchronously with their data and teachers. This allowed students and teachers to begin addressing any misconceptions that occurred during the prediction stage. Keeping the students engaged, giving them an opportunity to predict the shape of the graph, and providing simultaneous data visualization of the phenomenon helped to support the conceptual change process. In this article, we examine how RSII helped students construct meaning during the inquiry process.
Keywords: remote science inquiry instruction, online lesson study, hands-on inquiry, predict–observe–explain (POE), misconceptions, student engagement
Résumé : Cette étude de cas a examiné l'enseignement à distance en utilisant l'enseignement de la recherche scientifique à distance (RSII) pour soutenir un laboratoire pratique sur le mouvement sur un plan incliné. Les actions des enseignants et des étudiants, collectivement le cas, sont rapportées ici alors qu'ils ont mis en œuvre le RSII en utilisant une leçon développée par trois enseignants pendant une étude de leçon en ligne (Lewis & Hurd, 2011). La préparation des élèves a été jugée primordiale dans les phases d'étude et de planification au cours de l'étude de cours, sachant que les élèves, géographiquement disparates, mèneraient l'enquête pratique à l'aide des sondes et interfaces Vernierâ pendant l'enseignement synchrone et le soutien de l'enseignant via Brightspace. Un document Google Doc, contenant des liens hypertextes vers des vidéos Screencastify, a été élaboré pendant la phase de planification afin de former les élèves à l'utilisation du matériel de sondage nécessaire à la réalisation de l'enquête.
Les enseignants ont utilisé la stratégie d'enquête POE pour faire participer les élèves et obtenir des exemples de leur réflexion pendant la phase d'enseignement de l'étude des leçons (prédire, observer, expliquer, White & Gunstone, 1992). Dans la phase de prédiction, les élèves ont dessiné la forme du graphique et ont fourni un raisonnement pour leur prédiction. Ensuite, les élèves ont mené l'enquête sur le plan incliné afin d'observer le phénomène pendant que les données relatives au mouvement étaient collectées et représentées simultanément sous forme de graphique pour les élèves. Voir les représentations graphiques du mouvement ont permis aux élèves de participer à l'étape d'explication de la POE, où l'engagement synchrone de RSII avec leurs données et les enseignants ont commencé à aborder toutes les idées fausses de lThis case study examined distance education (DE) teachers using remote science inquiry instruction (RSII) to support a hands-on lab for motion on an inclined plane. The RSII lesson was developed as part of an online lesson study (Lewis & Hurd, 2011). The activities of the teachers and students, collectively the case, are reported by the phase of lesson study. During the Study and Plan phases of the lesson study, student preparation was deemed paramount. Students at disparate geographical locations needed to be ready to conduct the hands-on inquiry. The students used Vernier probe ware and interfaces during synchronous instruction, and teacher support via Brightspace. A Google Doc, with hyperlinked Screencastify videos, was developed during the Plan phase to train students in how to use the probe ware required to conduct the inquiry. a phase de prédiction. L'engagement des élèves, la visualisation simultanée des données du phénomène et la prédiction personnelle ont soutenu le processus de changement conceptuel. La façon dont la RSII favorise la construction de sens par les élèves au cours du processus d'enquête est discutée.
Mots-clés : instruction d'enquête scientifique à distance, étude de cours en ligne, enquête pratique, prédire-observer-expliquer (POE), idées fausses, engagement des élèves
This work is licensed under a Creative Commons Attribution 3.0 Unported License.
Instructional technology has changed since the early 1980s when computers and their thought-provoking software (Dickson, 1985) were introduced to K-12 classrooms. Present educational technology offers seemingly unlimited remote opportunities such as virtual labs and simulations (Price et al., 2019), real-time ecological observing on Ocean Networks Canada (https://www.oceannetworks.ca), and distant physical laboratories where students can remotely manipulate experiments (de Jong et al., 2014). When computers were first being used in the classroom, Mokros (1985) examined the impact of computer-based labs on students developing motion graphing skills and found that “middle school students are quite capable of producing and explaining graphs of position and velocity” (p. 6). Our investigation seeks to address a similar question, except the teachers included in this case study support Grade 10 science students, separated by distances ranging from 31 mi to 373 mi (50 km to 600 km), using Brightspace to deliver distance education (DE).
The extensive body of literature that exists about remote labs and virtual labs has been reviewed by Heradio et al. (2016). In addition, Zacharia et al. (2015) wrote specialized reviews and guidance on remote and virtual labs, and Sauter et al. (2013) wrote about the instructional authenticity of these tools. Although remote and virtual labs are sometimes suggested as an alternative to hands-on laboratories (Heradio et al., 2016), virtual manipulatives are not the same as physical lab equipment (Olympiou & Zacharia, 2012). Our study examines the blended use of technology, physical apparatus, and synchronous remote teacher guidance to support a hands-on lab. When these three components are used together, a unique form of DE teaching is possible called remote science inquiry instruction (RSII). In the high-school context, RSII is similar to remote laboratories and virtual laboratories. For example, with RSII a teacher is generally present (Eslinger et al., 2008). Also, RSII may include different forms of collaboration (Sinha et al., 2015), and the teacher or simulation may provide support or feedback (Zacharia et al., 2015). If the inquiry addresses a hypothesis or answers a question, students may be cognitively and metacognitively engaged (Brinson, 2015, 2017).
The students included in this investigation were from remote schools. They were not working alone such as a person might do in a home study lab (Kennepohl, 2013). In a home study lab, a university student might conduct “laboratory work off-campus on their own” using kits, kitchen science, self-directed field-work, or a combination of these things (p. 674). The distinguishing features of an RSII inquiry are the hands-on requirement, and the use of a web-based communication and application sharing platform for synchronous communication. The participants in this case study used Brightspace. The pedagogy that informs RSII is situation-specific and contextually determined (Kim & Hannafin, 2004) for DE students in schools during a pandemic. This type of instruction has been used by science teachers at the Centre for Distance Learning and Innovation (CDLI) for two decades. RSII was a proven pedagogical approach before it was suggested as a response to a pandemic. However, this is the first case study that documents CDLI teachers using RSII with students.
The focus on scientific inquiry is a common thread in literature about remote laboratories, virtual laboratories, and RSII. Hofstein and Lunneta (1982, 2003) reviewed the teaching benefits of the science lab. They specifically discussed inquiry empowering technologies, noting student benefits. “By using associated software, they can examine graphs of relationships generated in real time as the investigation progresses, and examine the same data in spreadsheets and in other visual representations” (Hofstein & Lunneta, 2003, p. 41). Yet, teachers may view inquiry-based instruction as a difficult paradox to solve as they seek to balance their desire to engage students in activities for skill development against a curriculum that emphasizes basic academic tasks (Loyens & Gijbels, 2008). Recent curriculum changes address the paradox by emphasizing the importance of scientific skills. The newly minted K-12 science curriculum (https://www.gov.nl.ca/education/k12/curriculum/guides/science/) in Newfoundland and Labrador includes an “Integrated Skills Unit.” Further, the Next Generation science standards (https://www.nextgenscience.org/) published by the National Research Council (NRC, 2012) state that science and engineering practices are an important dimension for science learning and:
better explain and extend what is meant by “inquiry” in science and the range of cognitive, social, and physical practices that it requires. Students engage in practices to build, deepen, and apply their knowledge of core ideas and cross-cutting concepts.
These curricular changes are supported by decades of empirical findings from inquiry instruction research (Hofstein & Lunneta, 2003; Minner et al., 2010). The reason that lab investigations are more engaging for students (DiBiase & MacDonald, 2015; Wilson et al., 2010) is likely that they position students at the centre of their learning during scientific investigation, and the role of teachers is to scaffold student learning (Minner et al., 2010; Zacharia et al., 2015). Inquiry is recognized as an inclusive form of pedagogy (Duran & Duran, 2004; Meyer et al., 2012; Meyer & Crawford, 2015). Certainly, inquiry is more inclusive and more effective than lectures (Blanchard et al., 2013).
Research suggests that taking care of individual professional development and developing communities of professional learning are crucial for increasing the number and quality of high-school science inquiry lessons (Blanchard et al., 2013; Miranda & Damico, 2013, 2015). The RSII lesson used in this investigation is the product of a 16-week lesson study (Lewis & Hurd, 2011). Our research focused on the actions of the teachers and students during the remote inquiry, and the reflections of the teachers and other members of the lesson study group. This unique study addressed a literature gap by reporting situation-specific and contextual factors for a high-school science inquiry lesson held remotely. The RSII described in this study is a kinematics investigation that focuses on knowledge and skill outcomes from local provincial curriculum (Newfoundland and Labrador Department of Education, 2018). However, the “Motion on an Inclined Plane” inquiry also engages students with Next Generation Science Standards, science and engineering practices such as “Planning and Carrying Out Investigations” and “Analyzing and Interpreting Data” (NRC, 2012).
RSII employs remote technology to manage and support students as they collect data in their remote locations to answer inquiry questions. The RSII used in this study included one structured inquiry, and one confirmation inquiry and examined motion on an inclined plane (Banchi & Bell, 2008). The students collected motion data in their remote contexts using the LabPro and Motion Sensor 2 from Vernier Inc. (https://www.vernier.com/). During the lesson study, the group decided the inquiry lesson would employ the predict–observe–explain (POE) strategy first developed by White and Gunstone (1992) and later popularized by Haysom and Bowen (2010).
Research about using POE has found that the technique helps unearth and address student misconceptions about factors such as circuits (Phanphech et al., 2019), force and motion (Kearney & Treagust, 2001), and colours of light (Keleş & Demirel, 2010). An early longitudinal investigation applied POE to a first-year undergraduate physics course. The course used qualitative conceptual problems and worked examples from the teacher (Searle & Gunstone, 1990), rather than the simulations and hands-on laboratories described above. The investigation reported initial success, although long-term conceptual change was not evident in their study group. For the student to cognitively engage with the concept of motion on an inclined plane, they need to predict the results of the experiment. The predict stage of POE is vital for students because it engages them in the research question, and allows them through cognition to create an expression of their conception (Gunstone & Mitchell, 2005; White & Gunstone, 1992).
In our study, students were asked to predict the shape of the motion graph and provide reasoning for their prediction. Many other studies have reported that students experience challenges with kinematics graphing (Beichner, 1994; Kozhevnikov & Thornton, 2006; McDermott et al., 1987). Based on his 28 years of experience with high-school student inquiry, Patrick Wells, the first author of this case study, agrees with these findings. In the POE of this investigation, after their prediction, students conducted the inclined plane inquiry to observe the phenomenon and then explain the phenomenon they observed. In a formal report, the students reconciled the differences between their predictions and what actually happened. Engaging students’ prior knowledge during inquiry supports the social construction of knowledge (Colburn, 2000).
This case study (Merriam, 1998) was an online interpretive inquiry (Merriam & Tisdell, 2015) of RSII. The case study examined the development and enactment of a DE inquiry lesson developed during a 16-week remote lesson study (Wells et al., 2023). The boundaries of this holistic descriptive account were drawn around the three teachers and their students.
The lesson study participants were two DE teachers purposefully sampled from the CDLI and the first author (Table 1). CDLI is a division of the Newfoundland and Labrador English School District. Since 2001, CDLI (https://www.cdli.ca) has been dedicated to “the development and delivery of senior high-school distance education programming to students attending high schools in rural, remote, and isolated regions of the province” (Centre for Distance Learning and Innovation, n.d.).
To conduct synchronous instruction in remote geographic locations, we employed https://www.d2l.com (https://www.d2l.com). The number of remote school locations that joined synchronous science classes varied from seven to ten per class. Some remote schools had four to five students in a DE science class; others had two to three students. The class sizes varied from 18 to 22 students. Due to internet bandwidth issues in rural areas, instruction employed in Brightspace did not include continuous student camera connections with the teachers. However, all of the students could see the teachers, share applications, and communicate by audio as well as through public and private chat.
The teachers, referred to as the lesson study group, developed and conducted the remote inquiry as part of the lesson study cycle (Lewis & Hurd, 2011). They included a retired CDLI teacher/administrator acting as a knowledgeable other, a CDLI administrator, school principals from remote sites within the Newfoundland and Labrador English School District, and CDLI staff who supplied technical and logistical support to the lesson group.
Table 1
Participant Information
| Pseudonym | Lesson Study Group Position | Teaching Experience | Education |
|---|---|---|---|
| Dianne | CDLI Remote Teacher | 17 years | BSc, BEd, MEd (in progress) |
| Norman | CDLI Remote Teacher | 21 years | BSc, BEd, MEd |
| Paddy (first author) | Researcher and Remote Teacher | 28 years | BScH, MSc, BEd, PhD Candidate |
Due to the COVID-19 pandemic, ethical clearance required remote research protocols. The geographically separated teachers communicated, collaborated, and held lesson study meetings using Google Suite apps including Google Meet, Google Docs, and Gmail. The first four weeks of the investigation included professional learning related to lesson study and science inquiry instruction. The majority of the lesson study meetings were conducted using Google Meet. Asynchronous lesson development used Google Docs. Other communication for logistics and questions involved Gmail, Google Calendar, and text messages. The lesson study was completed within a 16-week timeframe (see Table 2).
Table 2
Timeline, Activities, Interface or Context, and Data Sources Stage
| Timeline | Activities | Interface/Context | Data |
|---|---|---|---|
| Weeks 1–4 | Pre-interviews, Professional learning for lesson study and inquiry-based instruction | Google Meet & Google Docs | Field notes, Google Meet recordings*, Shared Google Docs |
| Weeks 4–11 | Study and Plan phases of online lesson study | Google Meet & Google Docs | Field notes, Google Meet recordings*, Shared Google Docs |
| Weeks 12–13 | Teach phase of online lesson study | Brightspace | Field notes from recorded lesson observation |
| Weeks 12 – 15 | Reflect phase of online lesson study | Google Meet & Google Docs | Field notes, Google Meet recordings*, Shared Google Docs |
| Week 16 | Focus group and final interviews | Google Meet | Field notes, Google Meet recordings* |
Note.*Transcribed. Professional learning for lesson study was based on, Lesson Study: Step by Step (Lewis & Hurd, 2011) and Mills College online resources (www.lessonresearch.net).
Teacher research in developing the inquiry lesson was guided by the Mills College definition of the Study, Plan, Teach, and Reflect phases of lesson study (Figure 1). To complete the scientific inquiry aspect of professional learning for inquiry instruction, we examined the levels of inquiry depicted in Banchi and Bell (2008), and discussed the challenges and rewards of supporting remote student inquiry.
During the Study phase, teachers reviewed the science curriculum (Newfoundland and Labrador Department of Education, 2018) and discussed the long-term learning needs of the students. A seminal consideration was that DE students were not supervised by an in-school science teaching specialist. The meetings held during the Plan phase revolved around preparing the lesson and examining the “Integrated Skills Unit” (Newfoundland and Labrador Department of Education, 2018). During Plan sessions, the teachers considered the technical and inquiry learning needs of the students, as well as the training students needed on how to use data collection devices.
Figure 1
Lesson Study Cycle
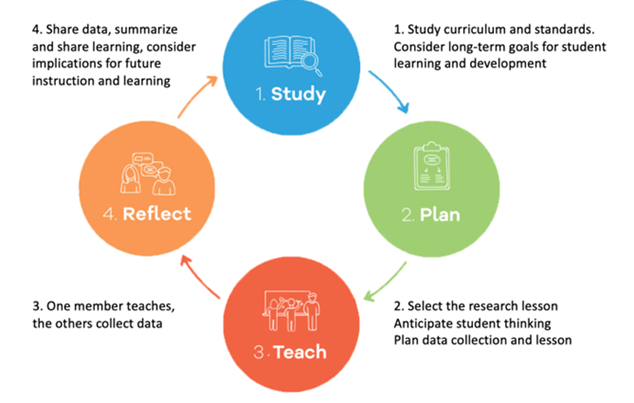
Note.Reprinted from The Lesson Study Group at Mills College (https://lessonresearch.net/resources/content-resources). Long Description of Figure 1. Lesson Study Cycle
In the Teach phase of lesson study, the teachers conducted RSII using the research lesson and the developed resources, synchronously in Brightspace. Each lesson was recorded, and the group members of the lesson study were given access to the lessons so they could make the lesson observations required for the Reflect stage. Dianne taught the lesson as a structured inquiry in which the students did not know the outcome of the lab (Banchi & Bell, 2008). After a reflection session, Norman re-taught the lesson as a confirmation inquiry in which students knew the outcome of the lab (Banchi & Bell, 2008). The second reflection conducted in Google Meet marked the end of the lesson study cycles. The research concluded with a focus group to discuss the importance of inquiry and teacher research as PL.
In case study research, triangulation contributes to the internal validity (Merriam, 1998). The multiple types of data in Table 2 were gathered through various collection methods, and from varied sources and contexts (Leavy, 2017). All data in this study were supplied to group members of the lesson study to ensure that the participant’s meanings were reflected in the case. This fostered internal validation of data sources (Cohen et al., 2017).
The field notes and lesson resources, along with the transcribed teacher interviews and meetings, were imported into MAXQDA to examine the lesson study activities of teachers and students. The initial framework for coding included two a priori code categories: Lesson Study codes and RSII codes. It also included sub-codes such as Level of Inquiry, Lesson Study Plan, and Lesson Study Teach. During repeated reading while listening to the audio recordings, subcategories emerged such as Lesson Study Collaboration, RSII Equipment Needs, RSII Outcomes, and Student Success. The strategy of creating categories lead to some open coding (Strauss & Corbin, 1998). This reflexivity was examined by Blair (2015). Our analysis approach involved using a top-down category template with open coding. We believe this approach “helped develop a bottom-up device that reflects key concepts that were found in the participant data” (p. 26).
The two DE teachers of this study, Dianne and Norman, taught Science 1206 to 21 remote DE schools. Dianne and Norman each connected synchronously with as many as seven different DE schools per class using Brightspace. The number of students per site ranged from two to five. While Dianne and Norman were synchronously connected to students with Brightspace, each DE school had a supervising teacher for the school’s DE classroom. The supervising teacher could support student safety including pandemic protocols, class management, and computer issues. However, the supervising teacher was not responsible for science lesson content, nor were they expected to be specialists at teaching science. Therefore, the lesson study group presumed the DE students would rely on the online resources and the DE teachers for content and technical support during RSII.
Following a review of the curriculum and remaining course units, the lesson study group decided to conduct the “Motion on an Inclined Plane” lab as the research lesson. This decision started the Plan phase of lesson study, and the teachers started training on how to use the data collection equipment and software required by the research lesson. One teacher struggled with obtaining motion data, but the issue was resolved by consulting with the knowledgeable other who suggested the newest motion sensor should be used to conduct data collection for objects closer that 5.9 inches (15 cm). This event and ongoing practice using the correct sensor focused the lesson study on elements required to support RSII during the Teach phase of lesson study. In later Plan meetings, the teachers examined logistics, data collection training, troubleshooting, and the pedagogical decision to use POE. They began by examining the logistics and determining the status of school-based equipment.
Each DE school had a CDLI Lab toolbox that included an interface, several types of probes, and the cables required to power and connect the interface to a computer. Figure 2 shows the toolbox components required for the RSII lesson, including the rolly object (a tin can or other object) to be procured by the students. Class surveys conducted by Dianne and Norman found most DE schools had toolboxes, but several toolboxes were missing the motion sensor. Dianne reported, “I've had the kids looking around, and I got a number of schools who don't have a motion detector in their toolboxes.” The DE school support promptly helped classes locate the missing items from their toolbox and CDLI staff supplied upgrades such as motion sensors to the schools. At each school there were desktop computers designated for DE with interface software and Google Chrome. As a result, all of the students could view shared lab documents, collect data, and analyze the results of the experiments. However, as Dianne reported, the version of the interface used at each school varied, “The newer kits have the LabQuest, some even have the LabQuest2!” The different versions of the interface created a student training issue that is discussed later.
As reported by Norman, the three main instructional challenges of RSII were “time limitations, getting everybody co-ordinated in ten different schools, all [with] different problems.” Questions asked by the lesson study group included: “Could this inquiry lab be completed in one class?” “Will troubleshooting interfere with important instructional activities such as providing feedback?” The group addressed these issues by planning asynchronous and synchronous student training.
Figure 2
Apparatus for Motion on an Inclined Plane Inquiry
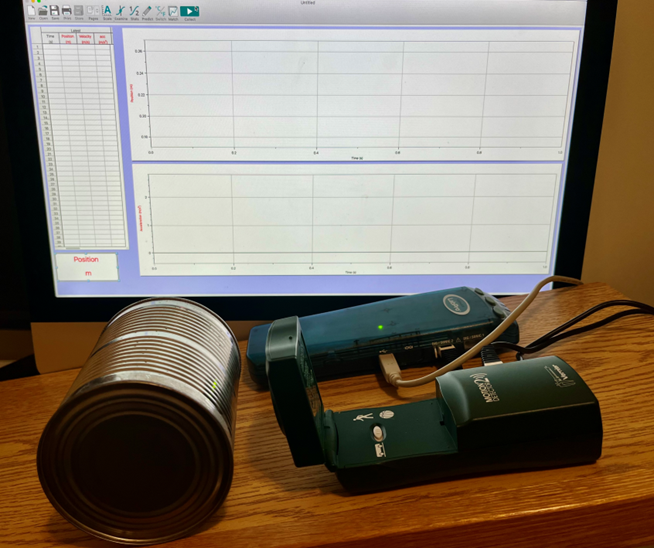
Note. This figure shows the apparatus for motion on an inclined plane inquiry that was used to measure the velocity of the can as it moved down the ramp away from the motion sensor (both in the foreground). The LabPro interface and monitor, with the data collection software, are in the background. As the can moved down the ramp (see Figure 5), a graph of motion was instantaneously produced.
To address the issue caused by multiple versions of the interface, the lesson study group developed a Google Doc with images and text descriptions of the cables, sensors, and the three versions of the interface that might be used. They added hyperlinks to Screencastify videos that showed in detail the process used to connect each version of the interface with the sensor and the computer. People following this process benefited from watching the video and listening to the sounds produced by the interface or probe to indicate the current mode of function. For example, when the motion sensing probe was properly connected to the interface, the sensor produced a characteristic clicking sound.
The Google Doc and hyperlinked videos were the only asynchronous instructions provided to help students set up the data collection devices. Norman felt, “The biggest trick is going to be getting them to actually make the equipment function.” He then added, “You'd have to take a class almost where . . . you're making them get the equipment to function… [The] lab itself wouldn't take that much.” The teachers decided it would be worthwhile for the students to have a practice session in using the equipment before doing the lab activity and they set aside a class for this purpose.
When the synchronous practice session started, most DE students had their equipment connected and turned on, ready to collect data. This showed the effectiveness of the asynchronous training document and hyperlinked Screencastify videos. The practice was a kinematic activity that required the students to create movement to mimic a distance-time graph. For example, students were shown a distance-time graph with a positive slope, a slope of zero, and then a negative slope. Next, they determined, by trial and error, or by examining the graph, the movement needed for the graph to be automatically created as the sensors collected motion data. For example, to create the distance-time graph mentioned above, they had to move away from the sensor (positive slope), stop (zero slope), and then move back towards the sensor (negative slope).
The practice activity was a success, not only in terms of training students to use the equipment, but also in terms of giving them an understanding of constant motion on a distance-time graph. Norman stated, “There were groups of mine who basically had the whole thing hooked up before I even had it shown on screen what was going to go on. They had everything together and plugged in.” Dianne reported similar levels of student proficiency, attributing this to, “The videos, the [Google Doc] files, and then the fact that we did the run-through.” Dianne reported, “They're getting really nice graphs…I demonstrated with my camera, as I set it up and they watched me walk back and forth, and that's what they did. And they're getting good!” The practice activity clearly helped some students connect motion with the distance-time graph produced by the interface. Norman was also pleased with the asynchronous support Google Doc. He summed up the importance of the practice and feedback for the remote students:
If you were there in person, it wouldn't have been so bad because you can just make everybody pick up the exact same thing as you, and we'll get together. Or, you can have it all laid out for them. But the virtual [environment] separated everybody, and what equipment they have, and stuff like that. Taking that time [for practice] was a big [advantage]. In my mind, that was a smart move.
When the synchronous RSII lesson started in Brightspace, over 90% of the students at remote school sites were ready to conduct the lab. They had their equipment set up and were ready for data collection. The students had already learned which materials they needed to procure and how to build an inclined plane from the Google Doc and Screencastify videos. For reasons that will be discussed later, a group in one school had difficulties. With that group, several students joined online from home, and did not have physical access to the equipment and inclined plane apparatus.
The introduction to the RSII lesson that was used by Dianne and Norman started with a modified check-in. This check-in asked the students to indicate whether they were ready for the experiment by selecting checkmarks on their Brightspace screen. Students were asked to collect images of their apparatus and the process they followed in setting up the equipment as evidence that they had the skills. Norman reminded students of the most important step, “Plug in the power last!” In less than 5 minutes, the students verified the ready status of their equipment, their sensors started making clicking noises, and the students were ready to proceed.
The formal lab started with a short review of the types of constant motion. This was an important reminder for the students. The short review reinforced the practice activity and set up the students to begin the formal “Motion on an Inclined Plane” lab. Before the class, the students received a lab document shared on Google Docs. Both teachers referred to this document as they reviewed uniform motion, acceleration, average velocity, and instantaneous velocity. However, this is where their lessons differed slightly. Dianne did not review acceleration on distance-time graphs, thereby making the lab a structured inquiry. In contrast, Norman reviewed the lab’s expected results as part of a confirmation inquiry (Banchi & Bell, 2008). The review lasted approximately 5 minutes and led into the first formal part of the “Motion on an Inclined Plane” lab, which was making a prediction. This formally started the POE portion of RSII.
The teachers asked the students to represent the rolly object (Figure 2) as it moved down the inclined plane. Each teacher drew a sample prediction (Figure 3) and encouraged students to draw their own prediction on their lab report sheet.
Figure 3
A Sample of Norman’s Prediction (RSII Lesson Field Notes)
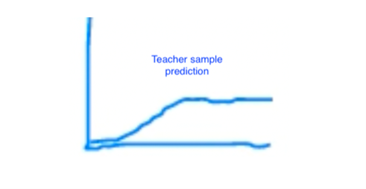
In asking for a prediction, the teachers were getting the students to represent observed motion as a graphed shape. How the students responded revealed their kinematic reasoning and all the students drew their prediction on the designated section of their lab report. The teachers encouraged students who wanted to share their predictions to draw on the Brightspace whiteboard. Dianne encouraged the students saying, “Your prediction is not going to be wrong, because it's what you think!” She added, “Is our experiment going to support what we thought it would look like? That's the fun part!”
Interestingly, nine out of ten of the public predictions were incorrect (Figure 4); as were many of the predictions observed on the student lab reports. In Figure 4, Students 5 and 4 demonstrated a common misconception, which is that the graph will take the same shape as the observed movement of an object down an inclined plane. Student 7 had the closest prediction, but did not account for the change in velocity as an object accelerates down a ramp. Figure 5, in which the line curved from 0.6 s to 1.6 s, indicates this change in velocity. It was important for the teachers to know about student misconceptions so that they could guide data collection and offer appropriate instruction as the lab continued.
Figure 4
Student Predictions of Distance-Time Graph for Object Rolling Down an Inclined Plane
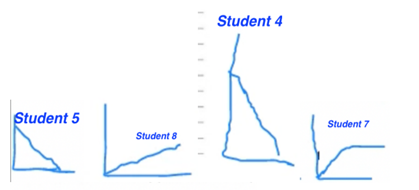
Figure 5
The Graphical Result of Rolling an Object Down an Inclined Plane
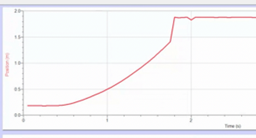
Note.Figure 4 and Figure 5 show distance on the y-axis and time on the x-axis. Figure 5 shows the curved line that is typical of acceleration.
Norman conducted the confirmation inquiry. During the lesson study Reflect stage, When Norman was asked if his students understood motion on an inclined plane, he said, “Well, the fact that none of them got predictions right really became something else. But none of them got predictions right.” Many students in all classes demonstrated well documented challenges in expressing the motion they observed as a graphical prediction (Beichner, 1994; Kozhevnikov & Thornton, 2006).
At approximately 15-minutes into the lab, the students in each RSII class started data collection. Norman had set up lab groups in which each student had a role. This ensured that COVID-19 protocols were followed for high-touch surfaces and objects such as the rolly object. Both teachers were active as students quickly shared their results on Brightspace. When a student asked about the sharp change in the graph followed by a slope of zero (Figure 5), Norman explained that “The first two seconds of the experiment was a nice graph.” After that, there was a “crash at the end,” resulting in a zero velocity. Throughout data collection, the teachers offered dynamic formative assessments similar to this example. They also provided scaffolding for students to understand the results, such as reminding them to identify errors and to clarify which parts of the graph provided good data. This was done for each unique data set from multiple DE school sites.
Several students were unable to attend school during the lesson and were accommodated in two ways. If the student could connect to Brightspace for the synchronous class, they guided the teacher through the experiment, sending the teacher text messages on what to do next. If the student could not connect to Brightspace, they watched a recording of the other students guiding the teacher through the experiment. Whether the student did the lesson at home using Brightspace or watched a recording, they used the same Google Drive data files as the other students.
All of this happened at the same time as students at DE schools who did not need accommodations conducted their experiments. Students at home with access to Brightspace guided the teachers through data collection. Acting as proxies for the students at home, Norman and Dianne watched the Chat on the video feed. They followed the instructions students typed into Chat as they completed the rolly object experiment. When students at home typed, “Go!”, the object was set in motion on the inclined plane and the graphical results were presented in the application that was being shared in Brightspace. This process involved several characteristics common in a remote lab (de Jong et al., 2021).
CDLI computers do not have a camera because of bandwidth issues. Due to this sensory limitation, it can be challenging for teachers to notice classroom events (Criswell et al., 2021). Most data sharing between the students and teachers was ongoing. The teachers communicated with their students about the shapes of their graph. The lack of results from one school group stood out to Norman, “I found that the school that had the most difficulty keeping on track and getting good results was the school that had other [non-science] students in the room with them at the same time.” Norman offered a solution. He suggested that teachers tell their students to turn on their Chromebook and camera. That way the teachers could watch what was happening in class. Norman also said this about the issue:
The challenges and needs that became apparent were that students often could use more direct guidance than was easily possible at times . . . While they could see me, I could not see them, and was relying on their description input to help me troubleshoot and explain things. I feel if I was able to see them, these issues would have been much more readily addressed.
With improved remote internet reliability, the student cameras could be turned on. That would better support teacher noticing on Brightspace, and thereby allow teachers to manage and support student activities more effectively.
Additional Screencastify videos trained students in how to scale graphed data so that they could better resolve slopes. During the lab activity, teachers did not have time to review how graphs can be rescaled. Their primary concern was to ensure that students had an appropriate curve for examining instantaneous velocity and to complete their lab report. As they worked through the lab activity, some students demonstrated that they had learned how to rescale graphs from watching the Screencastify videos. Norman said to the other teacher, “I was wondering if you modified [the students’ graphs] for them, then sent it back to them to work on?” Dianne replied, “Yeah, and some of them modified [their graph] themselves.” Further, when Norman said that some of his students made “a better curve” he meant that they adjusted their graph scales to better demonstrate the relationship between the variables. In other words, they adjusted the x or y axis to more clearly show the relationship of distance over time. That the students were able to do this suggests that they learned how by following the instructions given in the Screencastify videos.
By the end of the synchronous RSII session, all of the student groups except for one, as well as all of the students learning at home, had successfully collected inclined plane data and had completed the Observe stage of the POE strategy of inquiry. The students included an analysis of their results in their lab report, thereby making it possible for them to also address their predictions and any misconceptions they may have had. The students’ goal in completing the report was to use their lab data to calculate tangent slopes and demonstrate the instantaneous changes in velocity that occurred during the experiment. As part of the Explain stage of POE inquiry, students were asked to address any misconceptions they had about motion.
During the Reflect stage of lesson study, POE predictions and formative evaluations were discussed. All of the teachers agreed that the student predictions were more than just a tactic to promote cognitive engagement. Norman observed that student predictions were also a good way to keep students motivated. “A lot of times with your high-school students, there's a certain complacency and getting them to start off by making the prediction gets them in the mind to start thinking about what they're doing. Right?” Although the vast majority of the predictions were incorrect, there was nevertheless value in getting the students to make a prediction. As Norman said, “They realize that afterwards. But they were just making their predictions.” Dianne reported that students started to connect the graphical motion and data sets with observed motion. “I like how the velocity sets them up and the kids now know how to verify if it's actually stopped. They'll go down [in the data], and check and see if the velocity is zero.” For Dianne, instructing classes using data collected by students and the graphs served a cognitive purpose:
It's the first time I've done graphs, yeah, especially the distance-time graphs they're able to describe . . . I'm like, ‘Write me three lines that describe the object moving.’ And they're like, ‘It stopped for a few seconds. It moved forward at a fast velocity. Stopped. It paused, and it came back toward where it started.’ And they're actually starting to put paragraphs together for me.
Dianne also thought that building the apparatus and having the physical experience of conducting the lab was important for student learning and engagement:
It's ownership. It’s authenticity. If it's not yours, you're not going to remember. It is not going to mean anything . . . So, once the kids get that in their hands and that becomes their experience, that was their ball, that was their ramp, that was their graph. We talked this morning about how we analyzed the graph of the big blue ball. That big blue ball meant something to those kids. That graph all of a sudden became theirs . . . and that's what enriches the activity. So, the more you can get the kids engaged and it becomes theirs, then that's where you’re learning and your deeper learning starts.
The focus group had many comments that echoed Dianne’s sentiment. The focus group also reaffirmed the value of placing students, not teachers, at the heart of the lesson. This approach has been well proven by research.
Kennepohl (2103) summarized the forms of DE science lab used for home study, virtual learning, and remote locations. Home study was described as a higher-education strategy for learners that allowed them to conduct labs off-campus. In order to complete home study, students used lab kits, practical kitchen science, household items, and self-directed fieldwork. RSII is a newly reported form of DE instruction that blends synchronous and asynchronous teaching. With RSII, skills are taught using physical and virtual resources. As part of the lab, students practise doing the skills they have learned, either on their own or with a DE teacher. Kennepohl suggests that simulations offer students autonomy, feedback, and the ability to explore phenomenon in an engaging manner that allows the students to control variables. “One can speed up or slow down different components of the work, which provides time to explore and relieves a student of tedious work not directly related to learning” (Kennepohl, 2103, p. 676). Similarly, the students of this study learned how to use the version of the interface on their system by exploring the Google Doc and repeatedly watching Screencastify videos. This allowed them to prepare for synchronous RSII.
How does a remote inquiry compare to an inquiry that uses RSII? Remote laboratories “employ remote control when an experiment or instrument is physically inaccessible.” By doing that, remote laboratories offer access to expensive equipment (Kennepohl, 2013), such as engineering apparatus (de Jong et al., 2013) or real equipment accessible at distance for science, technology, engineering, and math (STEM) education (de Jong et al., 2014). The results of remote inquiry are real and require students to analyze their results. Students will receive support as they do remote inquiry. However, that support may not come from a teacher who can answer questions that pass the Turing Test and deal with complicated graphs, by saying things such as, “If you ignore the peaks, it is a pretty good graph!” (Dianne). The Turing Test was conceived by Alan M. Turing as a way of determining whether a computer can think (Britannica, September 19, 2022). In this context, we are using the term to emphasize that teachers offer extra support to students specifically because of their ability to think and react.
Sinatra et al. (2015) noted that misconceptions are both prevalent and persistent in science possibly due to the “experiential nature of our background knowledge with science concepts”, adding that “many science conceptions conflict with human experience and perception” (p. 5). Given that students may have little experience with motion on an inclined plane and acceleration, it is not surprising that most of their predictions were incorrect or incomplete. Kozhevnikov and Thornton (2006) suggest that technology helps students understand motion concepts by linking graphical representations that show an object undergoing different types of motion. Graphs that show real and predicted motion of an object over time help students cognitively link motion with how a graph looks. The path to conceptual change (Posner et al., 1982) is seeing an object in motion and simultaneously watching graphs being created that represent the motion, even when this is presented as a demonstration (Hynd et al., 1994) or a simulation (Price et al., 2019) that students watch. The pre-lab practice with its multiple repetitions of experiments helped students make the connection between an object in motion and a graphical representation of that motion. This helped students understand constant motion. Without similar practice with acceleration, it is not surprising that inexperienced students struggled with this new type of motion.
Beichner (1994) found that students may have difficulty understanding graphs and noted that “graphs are efficient packages of data,” which makes them an important part of the vocabulary of physics learning (p. 751). Students may experience difficulties with graphical relationships, such as connecting acceleration with the fundamental change in shape shown on a distance-time graph as shown in this study (McDermott et al., 1987). Kozhevnikov and Thornton (2006) reported that different physics topics and problems have different spatial-visualization requirements. For example, “finding solutions for one-dimensional problems involving judgments about motion characteristics of only one object” (p. 165) may make lower demands on the visual-spatial working memory than multi-dimensional problems such as an acceleration graph. This seems logical. Acceleration interpreted as a rate of change versus constant motion is shown as a slope on a graph, and this derivative relationship may be a challenge for some students to understand (Jones, 2017). Kozhevnikov and Thornton (2006) reference cognitive research to explain that interpretations of kinematic graph problems, such as the predictions by the students in this study, “require high visual-spatial resources'' (p. 125). They go on to suggest that translating “an abstract graphical representation into a real motion event” is a process in which so-called “low spatial students” might experience more difficulties (p. 125). Kozhevnikov and Thornton (2006) go on to suggest that memory-based learning (MBL) reduces cognitive load. We agree that graphical representations such as RSII for motion on an inclined plane are a useful way to solve this problem. At the very least, using POE opens a window into student misconceptions and sets the stage for using student-collected data and teacher scaffolding, to start the process of conceptual change (Posner et al., 1982).
TThe teachers of this study believe ownership is possible in a remote classroom. Enghag and Niedderer (2008) found that students in lab groups for physics mini-projects demonstrated individual ownership through their actions of choice and control. A study of science student ownership by O’Neill (2010) examined physical structures and found that the teacher’s role is integral in “aiding [the] student’s cultivation of ownership” (p. 17). In RSII, having the students working on their own to use data collection tools was vital to the experiment. The students demonstrated engagement and ownership, which is a “powerful means for students to affect change in their lives, increased levels of science engagement, and promote authentic participation” (p. 19). Szalay and Tóth (2016) studied step-by-step inquiry in chemistry with students similar in age to the students in this investigation. They found that step-by-step inquiry developed skills required for experimental design and they suggested that, “It is worth modifying traditional practical laboratory activities to ones where experiments have to be partially designed by students” (p. 929).
In two reviews, Brinson (2015, 2017) examined learning achievement during traditional labs with hands-on activities versus non-traditional labs that are either virtual or remote. Brinson found that the virtual and remote labs were as good as or better than traditional labs in many categories of learning. RSII labs have aspects of both traditional and non-traditional labs. The non-traditional labs in RSII blend Screencastify videos with hands-on use of a virtual or physical apparatus. As set out in the science and engineering practices included in the Next Generation Science Standards, students in this study had to plan and carry out investigations, analyze and interpret data, use mathematics and computational thinking, and construct explanations (NRC, 2012). This covers four of the eight science and engineering practices. In “Light and Colour,” a study that employed both physical of virtual manipulatives for teaching the topic, Olympiou and Zacharia (2012) found that the blended condition “enhanced students’ understanding of concepts that were introduced through the curriculum material of the study” (p. 38). They found that the students understanding was enhanced more by the blended condition than it would have been by singular physical and virtual conditions. We agree with their suggestion that the RSII blending of materials is “more conducive to learning through laboratory experimentation” (p. 42).
The structure of lesson study fits well with the basic premise of good inquiry for professional learning. According to this premise, good inquiry should be situated in the teacher’s context (Lave & Wenger, 1991), include reflection (Schön, 1983), and involve a proven model for inquiry instruction (White & Gunstone, 1992). In some ways, RSII is similar to a home-study lab (Kennepohl, 2013), simulations (Price et al., 2019), and remote labs (de Jong et al., 2014). However, these distinctive types of remote instruction lack the unique blended asynchronous and synchronous forms of instruction found in RSII. Further, this investigation demonstrates that students can successfully conduct an inquiry when provided asynchronous resources and online synchronous support. This investigation reinforces the importance of predictions in science instruction as an essential part of finding misconceptions and addressing them as the students construct meaning during the inquiry process (Colburn, 2000).
We recognize that qualitative inquiry is subjective. This study contains inferences about student engagement, ownership, and learning that are not quantitative. We could not review student labs. This limited our ability to find and more accurately describe student misconceptions.
The four steps of the Lesson Study Cycle are described as follows:
Banchi, H., & Bell, R. (2008, October 1). The many levels of inquiry. Science and Children, 46(2), 26–30. https://my.nsta.org/resource/6335/the-many-levels-of-inquiry
Beichner, R. J. (1994, March 1). Testing student interpretation of kinematics graphs. American Journal of Physics, 62(8), 750–762. https://doi.org/10.1119/1.17449
Blair, E. (2015, January 19). A reflexive exploration of two qualitative data coding techniques. Journal of Methods and Measurement in the Social Sciences, 6(1), 14–29. https://doi.org/10.2458/v6i1.18772
Blanchard, M. R., Osborne, J. W., Wallwork, C., & Harris, E. S. (2013, January). Progress on implementing inquiry in North Carolina: Nearly 1,000 elementary, middle and high school science teachers weigh in. Science Educator, 22(1), 37–47. https://eric.ed.gov/?id=EJ1062250
Brinson, J. R. (2015, September). Learning outcome achievement in non-traditional (virtual and remote) versus traditional (hands-on) laboratories: A review of the empirical research. Computers & Education, 87, 218–237. https://doi.org/10.1016/j.compedu.2015.07.003
Brinson, J. R. (2017, July 26). A further characterization of empirical research related to learning outcome achievement in remote and virtual science labs. Journal of Science Education and Technology, 26(5), 546–560. https://doi.org/10.1007/s10956-017-9699-8
Centre for Distance Learning and Innovation. (n.d.) About us. https://www.cdli.ca/about-us.html
Cohen, L., Manion, L., & Morrison, K. (2017). Research methods in education (8th ed.). Routledge.
Colburn, A. (2000, October 22). Constructivism: Science education's “grand unifying theory”. The Clearing House: A Journal of Educational Strategies, Issues and Ideas, 74(1), 9–12. https://doi.org/10.1080/00098655.2000.11478630
Criswell, B., Krall, R., & Ringl, S. (2021). Video analysis and professional noticing in the wild of real science teacher education classes. Journal of Science Teacher Education, 32(5), 531-554.
D2L (n.d.) Why D2L? https://www.d2l.com/why-d2l/
de Jong, T., Gillet, D., Rodríguez-Triana, M. J., Hovardas, T., Dikke, D., Doran, R., Dziabenko, O., Koslowsky, J., Korventausta, M., Law, E., Pedaste, M., Tasiopoulou, E., Vidal, G, & Zacharia, Z. C. (2021, January 11). Understanding teacher design practices for digital inquiry-based science learning: The case of Go-Lab. Educational Technology Research and Development, 69(2), 417–444. https://doi.org/10.1007/s11423-020-09904-z
de Jong, T., Linn, M. C., & Zacharia, Z. C. (2013, April 19). Physical and virtual laboratories in science and engineering education. Science, 340(6130), 305–308. https://doi.org/10.1126/science.1230579
de Jong, T., Sotiriou, S., & Gillet, D. (2014, October 16). Innovations in STEM education: The Go-Lab federation of online labs. Smart Learning Environments, 1(1), 1-16. https://doi.org/10.1186/s40561-014-0003-6
DiBiase, W., & McDonald, J. R. (2015, February 13). Science teacher attitudes toward inquiry-based teaching and learning. The Clearing House: A Journal of Educational Strategies, Issues, and Ideas, 88(2), 29–38. https://doi.org/10.1080/00098655.2014.987717
Dickson, W. P. (1985, May). Thought-provoking software: Juxtaposing symbol systems. Educational Researcher, 14(5), 30–38. https://doi.org/10.3102/0013189X014005030
Duran, L. B., & Duran, E. (2004). The 5E instructional model: A learning cycle approach for inquiry-based science teaching. Science Education Review, 3(2), 49–58. https://eric.ed.gov/?id=EJ1058007
Enghag, M., & Niedderer, H. (2008, December). Two dimensions of student ownership of learning during small-group work in physics. International Journal of Science and Mathematics Education, 6(4), 629–653. https://doi.org/10.1007/s10763-007-9075-x
Eslinger, E., White, B., Frederiksen, J., & Brobst, J. (2008, November 4). Supporting inquiry processes with an interactive learning environment: Inquiry island. Journal of Science Education and Technology, 17(6), 610–617. https://doi.org/10.1007/s10956-008-9130-6
Gunstone, R. F., & Mitchell, I. J. (2005). Teaching science for understanding. In J. J. Mintzes, J. H. Wandersee, and J. D. Novak (Eds.), Metacognition and conceptual change (pp. 133-163). Academic Press.
Haysom, J., & Bowen, M. (2010). Predict, observe, explain: Activities enhancing scientific understanding. NSTA Press.
Heradio, R., de la Torre, L., Galan, D., Cabrerizo, F. J., Herrera-Viedma, E., & Dormido, S. (2016, July). Virtual and remote labs in education: A bibliometric analysis. Computers & Education, 98, 14–38. https://doi.org/10.1016/j.compedu.2016.03.010
Hofstein, A., & Lunetta, V. N. (1982, Summer). The role of the laboratory in science teaching: Neglected aspects of research. Review of Educational Research, 52(2), 201–217. https://doi.org/10.2307/1170311
Hofstein, A., & Lunetta, V. N. (2003, December 3). The laboratory in science education: Foundations for the twenty‐first century. Science Education, 88(1), 28–54. https://doi.org/10.1002/sce.10106
Hynd, C. R., McWhorter, J. Y., Phares, V. L., & Suttles, C. W. (1994, November). The role of instructional variables in conceptual change in high school physics topics. Journal of Research in Science Teaching, 31(9), 933–946. https://doi.org/10.1002/tea.3660310908
Jones, S. R. (2017, March). An exploratory study on student understandings of derivatives in real-world, non-kinematics contexts. The Journal of Mathematical Behavior, 45, 95–110. https://doi.org/10.1016/j.jmathb.2016.11.002
Kearney, M., & Treagust, D. F. (2001, April 27). Constructivism as a referent in the design and development of a computer program using interactive digital video to enhance learning in physics. Australasian Journal of Educational Technology, 17(1). https://doi.org/10.14742/ajet.1773
Keleş, E., & Demirel, P. (2010). A study towards correcting student misconceptions related to the color issue in light unit with POE technique. Procedia-Social and Behavioral Sciences, 2(2), 3134–3139. https://doi.org/10.1016/j.sbspro.2010.03.477
Kennepohl, D. (2013). Teaching science at a distance. In M.G. Moore (Ed.), Handbook of distance education(3rd ed., pp. 486-498). Routledge.
Kim, M., & Hannafin, M. (2004). Designing online learning environments to support scientific inquiry. Quarterly Review of Distance Education, 5(1), 1–10. https://eric.ed.gov/?id=EJ874945
Kozhevnikov, M., & Thornton, R. (2006, March). Real-time data display, spatial visualization ability, and learning force and motion concepts. Journal of Science Education and Technology, 15(1), 111–132. https://eric.ed.gov/?id=EJ748829
Lave, J., & Wenger, E. (1991). Situated learning: Legitimate peripheral participation. Cambridge University Press.
Leavy, P. (2017). Research design: Quantitative, qualitative, mixed methods, arts-based, and community-based participatory research approaches. Guilford Publications.
Lewis, C. C., & Hurd, J. (2011). Lesson study step by step: How teacher learning communities improve instruction. Heinemann.
Loyens, S. M., & Gijbels, D. (2008, August 19). Understanding the effects of constructivist learning environments: Introducing a multi-directional approach. Instructional Science, 36(5), 351–357. https://doi.org/10.1007/s11251-008-9059-4
McDermott, L. C., Rosenquist, M. L., & van Zee, E. H. (1987, June 1). Student difficulties in connecting graphs and physics: Examples from kinematics. American Journal of Physics, 55(6), 503–513. https://doi.org/10.1119/1.15104
Merriam, S. B. (1998). Qualitative research and case study applications in education. Jossey-Bass.
Merriam, S. B., & Tisdell, E. J. (2015). Qualitative research: A guide to design and implementation. John Wiley & Sons.
Meyer, D. Z., Kubarek-Sandor, J., Kedvesh, J., Heitzman, C., Pan, Y., & Faik, S. (2012, September 1). Eight ways to do inquiry. The Science Teacher, 79(6), 40. https://eric.ed.gov/?id=EJ988033
Meyer, X. S., & Crawford, B. A. (2015, May 11). Multicultural inquiry toward demystifying scientific culture and learning science. Science Education, 99(4), 617–637. https://doi.org/10.1002/sce.21162
Minner, D. D., Levy, A. J., & Century, J. (2010, April). Inquiry‐based science instruction—What is it and does it matter? Results from a research synthesis years 1984 to 2002. Journal of Research in Science Teaching, 47(4), 474–496. https://doi.org/10.1002/tea.20347
Miranda, R. J., & Damico, J. B. (2013, December 8). Science teachers’ beliefs about the influence of their summer research experiences on their pedagogical practices. Journal of Science Teacher Education, 24(8), 1241–1261. https://doi.org/10.1007/s10972-012-9331-y
Miranda, R. J., & Damico, J. B. (2015, Summer). Changes in teachers' beliefs and classroom practices concerning inquiry-based instruction following a year-long RET-PLC program. Science Educator, 24(1), 23–35. https://eric.ed.gov/?id=EJ1069987
Mokros, J. R. (1985). The impact of microcomputer-based science labs on children’s graphing skills (ED264128). ERIC. https://eric.ed.gov/?id=ED264128
Newfoundland and Labrador Department of Education. (2018). Science 1206 curriculum guide 2018. https://www.gov.nl.ca/education/files/k12_curriculum_guides_science_science_1206_curriculum_guide_2018_sept7.pdf
National Research Council. (2012). A framework for K-12 science education: Practices, crosscutting concepts, and core ideas. National Academies Press. https://www.nextgenscience.org
Ocean Networks Canada. (n.d.). Live cameras. https://www.oceannetworks.ca/multimedia/live-cameras/"
Olympiou, G., & Zacharia, Z. C. (2012, January). Blending physical and virtual manipulatives: An effort to improve students' conceptual understanding through science laboratory experimentation. Science Education, 96(1), 21–47. https://doi.org/10.1002/sce.20463
O'Neill, T. B. (2010, February 5). Fostering spaces of student ownership in middle school science. Equity & Excellence in Education, 43(1), 6–20. https://doi.org/10.1080/10665680903484909
Phanphech, P., Tanitteerapan, T., & Murphy, E. (2019). Explaining and enacting for conceptual understanding in secondary school physics. Issues in Educational Research, 29(1), 180–204. https://eric.ed.gov/?id=EJ1203436
Posner, G. J., Strike, K. A., Hewson, P. W., & Gertzog, W. A. (1982). Accommodation of a scientific conception: Toward a theory of conceptual change. Science Education, 66(2), 211–227. https://doi.org/10.1002/sce.3730660207
Price, A., Wieman, C., & Perkins, K. (2019). Teaching with simulations. The Science Teacher, 86(7), 46–52. https://eric.ed.gov/?id=EJ1209297
Sauter, M., Uttal, D. H., Rapp, D. N., Downing, M., & Jona, K. (2013, June 7). Getting real: the authenticity of remote labs and simulations for science learning. Distance Education, 34(1), 37–47. http://dx.doi.org/10.1080/01587919.2013.770431
Schön, D. A. (1983). The reflective practitioner: How professionals think in action. Basic Books.
Searle, P., & Gunstone, R. F. (1990, January). Conceptual change and physics instruction: A longitudinal study [Paper presentation]. American Education Research Association Conference, Boston.
Sinatra, G. M., Heddy, B. C., & Lombardi, D. (2015, February 27). The challenges of defining and measuring student engagement in science. Educational Psychologist, 50(1), 1–13. https://doi.org/10.1080/00461520.2014.1002924
Sinha, S., Rogat, T. K., Adams-Wiggins, K. R., & Hmelo-Silver, C. E. (2015, September 3). Collaborative group engagement in a computer-supported inquiry learning environment. International Journal of Computer-Supported Collaborative Learning, 10(3), 273–307. https://doi.org/10.1007/s11412-015-9218-y
Strauss, A., & Corbin, J. (1998). Basics of qualitative research techniques. Sage Publications.
Szalay, L., & Tóth, Z. (2016). An inquiry-based approach of traditional ‘step-by-step’ experiments. Chemistry Education Research and Practice, 17(4), 923–961. https://doi/10.1039/C6RP00044D
The Lesson Study Group at Mills College. (n.d.). Content resources. https://lessonresearch.net/resources/content-resources/
Turing test. (2022, September 19). In Britannica. https://www.britannica.com/technology/CAPTCHA
Wells, P. R., Goodnough, K., Azam, S., & Galway, G. (2023). Changes in high school distance education science teachers’ pedagogical content knowledge (PCK) during remote lesson study. In R. Huang, N. Helgevold, J. Lang, & J. Heng (Eds.), Teacher professional learning through lesson study in virtual/hybrid environments: Opportunities, challenges, and future directions. Routledge.
White, R. & Gunstone, R. (1992). Prediction-observation-explanation. In R. White, & R. Gunstone (Eds.), Probing understanding (pp. 44–64). The Falmer Press.
Wilson, C. D., Taylor, J. A., Kowalski, S. M., & Carlson, J. (2010, March). The relative effects and equity of inquiry‐based and commonplace science teaching on students' knowledge, reasoning, and argumentation. Journal of Research in Science Teaching, 47(3), 276–301. https://onlinelibrary.wiley.com/doi/10.1002/tea.20329
Zacharia, Z. C., Manoli, C., Xenofontos, N., de Jong, T., Pedaste, M., van Riesen, S. A., Kamp, E. T., Maeots, M., Siiman, L., & Tsourlidaki, E. (2015, February 26). Identifying potential types of guidance for supporting student inquiry when using virtual and remote labs in science: A literature review. Educational Technology Research and Development, 63(2), 257–302. https://doi.org/10.1007/s11423-015-9370-0
Patrick R. Wells is a PhD candidate in the Faculty of Education at Memorial University, St. John’s, NL, Canada. Pat is an award winning secondary and post-secondary teacher with publications in science and education literature. His present research interests include science inquiry, teacher learning, place-based education, and ocean literacy. He may be contacted at p.wells@mun.ca
Karen Goodnough is a former Dean of the Faculty of Education and Professor of Science Education at Memorial University, St. John’s, NL, Canada. Dr. Goodnough is a well-known author and speaker in the areas of action research, inclusive science education, pre-service teacher education, problem-based learning, STEM (Science, Technology, Engineering, and Mathematics) education, teacher knowledge, and teacher professional learning. She may be contacted at kareng@mun.ca
Gerald Galway is a Professor of Leadership and Policy Studies and Dean of the Faculty of Education at Memorial University, St. John’s, NL, Canada. Dr. Galway is a widely published researcher and author whose books/book chapters and articles cover such areas as research-informed policy, teacher education, learning technologies, school system governance and education reform. He may be contacted at ggalway@mun.ca
Saiqa Azam is an Associate Professor of Science Education of the Faculty of Education, Memorial University, St. John’s, NL, Canada. Dr. Azam’s research interests include science education, teacher’s thinking/cognition/learning, pedagogical content knowledge, professional knowledge of practice, pre-service teacher education. She may be contacted atsazam@mun.ca
![]() This work is licensed under a Creative Commons Attribution 3.0 License.
This work is licensed under a Creative Commons Attribution 3.0 License.