Vol. 38, No. 2, 2023
https://doi.org/10.55667/ijede.2023.v38.i2.1289
Abstract: This study discusses the findings of a survey designed to capture students’ allocations of credibility to online materials resembling social media posts. The survey respondents were 1,019 undergraduate students at a medium-sized Canadian university. The students came from a range of programs and years of study in those programs. The survey instrument presented varying stimuli to students to see how their scores varied, and then asked students to explain their scoring. A number of significant dynamics emerged, such as the students’ tendency to give lower credibility scores to poorly presented information, even if the information was factual, and to explain information by referring to previous knowledge. These dynamics varied little by area or year of study, which suggests that presentation should be recognized as a powerful heuristic in online credibility assessment.
Keywords: credibility, social media, undergraduate, survey research
Résumé : Cette étude présente les résultats d'une enquête visant à déterminer la crédibilité que les étudiants accordent aux documents en ligne ressemblant à des messages de médias sociaux. Les répondants à l'enquête étaient 1 019 étudiants de premier cycle d'une université canadienne de taille moyenne. Les étudiants provenaient d'un éventail de programmes et de différentes années d'études dans ces programmes. L'instrument d'enquête présentait différents stimuli aux étudiants afin de voir comment leurs scores variaient, et demandait ensuite aux étudiants d'expliquer leur notation. Un certain nombre de dynamiques significatives sont apparues, telles que la tendance des étudiants à accorder des scores de crédibilité plus faibles aux informations mal présentées, même lorsqu'elles sont factuelles, et à expliquer les informations en se référant à des connaissances antérieures. Ces dynamiques varient peu en fonction du domaine ou de l'année d'étude, ce qui suggère que la présentation devrait être reconnue comme une heuristique puissante dans l'évaluation de la crédibilité en ligne.
Mots-clés : crédibilité, médias sociaux, premier cycle universitaire, enquête de recherche
This work is licensed under a Creative Commons Attribution 3.0 Unported License.
The recent reliance on online teaching and learning in K-12 and higher education as a response to the COVID-19 pandemic has had a significant effect on the field of online education. More educators are familiar with, and experienced in, teaching through online platforms than ever before. Online teaching has become an expectation for all instructors, rather than a few highly-skilled specialists. Furthermore, the increase in online education comes with a need for a deeper understanding of the quality and effectiveness of the modalities used. This study sets out to help inform the expansion of online learning by describing the perspectives of a general body of undergraduate students regarding the credibility of online information.
The title of this article is based on the last two lines in “Ode to a Grecian Urn” by John Keats: “Beauty is truth, truth beauty,—that is all / Ye know on earth, and all ye need to know” (Keats, 2023).
One of the functions of education, regardless of modality, is to help people think differently. To do this, the learner needs to be provided with new information they can take seriously and consider incorporating into their schema. While a lot is known about the ways in which learners approach new information reflectively and deliberatively, less formal models for processing information are still emerging (Metzger & Flanigan, 2013). This study contributes by examining how learners evaluate information in the familiar contexts that require rapid processing that are found in social media formats. Data collection involved formats resembling Facebook, Twitter (now known as X), and Instagram. While the contextual differences between Learning Management Systems (LMS) and social media are significant enough that findings may not transfer directly, the study provides insights into the most familiar types of judgment learners may make.
The COVID-19 pandemic (2019–2022) resulted in explosive growth in online higher-educational delivery as many universities were forced to deliver their entire course catalogue in this way. While, remarkably, institutions and individual instructors rose to this challenge and students generally responded well, the experience raises questions about what it means to deliver high-quality online learning opportunities and the strategies necessary to support them (Mphahlele et al., 2023). Under the pressure of a pandemic, it seems likely that developing online courses and ensuring students have access to them was given higher priority than coming up with the best possible design. As many of the courses developed under these conditions continue to be offered, it would seem appropriate to loop back and revisit key issues of online delivery.
One issue of concern across many areas of education is the credibility of information. Considerable research has been done on what this means in an online environment. A lot of this work focuses on the factors that promote credibility, while leaving the specific meaning of credibility relatively open. For this study, we define credibility as the believability of information that is derived from the message, its source, or both (Metzger & Flanagin, 2013). This definition will be discussed in more depth later in the paper. For now, it is important to note that this discussion does not consider credibility and truth to be identical. Information can be believable without being factual and vice versa.
Credibility is a key component of learning. The American Psychological Association definition of learning includes the following statement:
Learning involves consciously or nonconsciously attending to relevant aspects of incoming information, mentally organizing the information into a coherent cognitive representation, and integrating it with relevant existing knowledge activated from long-term memory (American Psychological Association, 2023).
Key to this definition is the notion of “relevant aspects of incoming information.” Credibility is an important quality of incoming information because it supports the perception that the incoming information is relevant, which leads to incorporating the incoming information into cognitive representations. Without believability, it seems unlikely that new information will gain purchase on the thinking of the learner. One challenge for online learning is to ensure the credibility of resources and instruction is maximized, which entails understanding as much as possible about how learners assess this quality.
Further to the definition offered earlier, credibility can be recognized as not only a characteristic of information, but as a relational judgment made by a knowing subject. The consumer of information decides how much credibility to assign to the information and how much to discount it. Different readers may assign different levels of credibility to the same text, and a single reader may think differently about the same text in different contexts. The final judgment of believability reflects the information as presented, the context of presentation, and the previous knowledge and perspectives of the person receiving the information.
There are several distinct approaches to understanding credibility. This review will not cover the work being done on machine learning and other computational approaches to credibility (such as Li et al, 2023; Kang et al., 2012). These perspectives focus on the systems rather than how people receive information. The current study focuses strongly on the human reaction as an outcome and seeks to learn more about how information consumers make decisions and assign credibility in social media contexts. Our central interest in this exploratory study is to capture learners’ immediate assessments of stimuli, as well as their own perception of how they reached these assessments. Immediacy was an important component of our approach.
In considering credibility, there are two significant layers: what is taken into account by information consumers when reaching a judgment and how they reach their conclusion given those factors. The first question has been answered in various ways, but generally involves three aspects of information: source, medium, and content (Buhlman & Gisler, 2006). Source refers to the derivation of the information. For example, people may judge the New York Times to be more credible than InfoWars (or vice versa), or they may decide that a particular author is believable, while another is less so. Medium reflects the actual platform on which the information is shared; for example, TikTok versus an LMS. Content refers to the perceived quality of the information delivered in multi-modal formats. This last aspect of information is somewhat problematic because judgments formed about content can appear circular if the information consumers are seen to judge credibility based on how credible they find the information. However, when judging content, learners are likely to take external factors into account, alongside their own experience and opinions (Rosenblatt, 1982), potentially interrupting the circularity.
In recent years, there have been several significant steps forward in understanding how consumers of information reach judgments. One insightful approach is referred to as document representation, which manifests in a mental schema known as document model(s) (Rouet et al., 2021; Perfetti et al., 1999). The fundamental idea is that “the intelligent use of texts entails mental representations of specific texts, situations described in texts, and relations among texts” (Perfetti et al., 1999, p. 99).
Judgments of credibility come into play when texts are inconsistent, leading the reader to evaluate the comparative value of the information.
When a document (i.e., a text with some information about the source) includes gaps, inconsistencies, or conflicts, readers can integrate the contents with the source(s) as a means to organize their mental representation of the situation, which would otherwise remain incoherent (Perfetti et al., 1999). This, however, involves an effortful process, which is more likely to take place when the task context makes it highly relevant. (Rouet et al., 2021, p. 75)
A well-established principle in studies of cognition is that people are inclined to harbour their cognitive resources. Given the opportunity, people will tend to use mental shortcuts and heuristics. For example, readers may rely on the reputation of the course, endorsements from people perceived to be similar to them, consistency with other texts, self-confirmation, lack of persuasive intent, lack of expectancy violation, or a combination of these factors (Metzger & Flanagin, 2013). In other words, if information matches what the reader already believes, it will be found more believable. Given that “using peripheral cues is the rule of web use, not the exception” (Fogg et al., 2003, p. 12), this raises significant questions about the opportunities for information consumers to evaluate information in a meaningful way. As argued in a recent paper linking self-regulated learning to using multiple sources, the learner has to know when to invoke the appropriate skills and be willing to do so (Greene et al., 2018).
Information consumers are more likely to assess information critically when their attention is directed to the significance of credibility or consequences are attached to evaluating credibility inaccurately (Hämäläinen et al., 2021). Evidence suggests that in academic settings, successful learners are better able to use their familiarity with multiple texts to distinguish between reliable and unreliable information (Kiili et al., 2019). They are also better able to make decisions and write argumentative texts. Frequently, the strategy applied by these learners is to assess the expertise of the information source, although this may require support to be effective (Rouet et al., 2021; Kohnen et al., 2020).
Assessment of a source may involve looking at the agency of the information, which includes the author, the website, and the platform (Salmerón et al., 2018). Many information processing models consider the intention of the source. One study of upper-secondary students suggests that when asked to find and assess sources for credibility, learners evaluate the venue of the information, then the evidence and author, but rarely the intention of the agency (Bråten et al., 2015). Assessing intention is a complex cognitive process that may not be easily compressed into a heuristic. When consumers assess information as lacking credibility the process of lessening the weight placed upon it is called discounting: “people attempt to discount when they discover that the source of a testimony attempts to deceive them or the source appears to be incomplete” (Schul & Mayo, 2014, p. 199).
However, there are complexities in the discounting process. For example, people only assess whether they should discount information after they have consumed it (by which time the information may have already made an impression). Also, people tend to discount less if the information appears to have implicit truth (although information that is factually wrong may match preconceptions or experience), and discounted information tends to re-emerge over time (Schul & Mayo, 2014). Even consciously evaluating credibility and discounting information when needed may not guarantee that only the most credible information is taken into account. A study of 14 to 18-year-old Spanish internet users found them more likely to spread information they liked, irrespective of their assessment of its credibility (Herrero-Diz et al., 2020).
A factor that appears to sidestep even conscious credibility assessments is presentation. This is demonstrated in a range of studies (Shabani & Keshavarz, 2022; Johnson & Kay, 2014; Fogg et al., 2003). This factor is referred to as “visual credibility” or “the believability of the nonverbal features of a communication medium” (Martin & Johnson, 2010, p. 166). The research suggests that if online information sounds right and looks right, consumers are likely to give it high credibility. This represents a significant challenge in a highly visual, short-form environment like social media.
Another layer in the assessment of credibility is the suggestibility of the information consumer. It has been posited that an information consumer’s degree of suggestibility is likely to remain the same, irrespective of their previous knowledge, although this tendency does seem to vary with age (Marsh & Umanath, 2014). This claim is based on a previous study claiming that older adults are less suggestible than younger adults, and therefore less likely to adopt misleading information provided by stories. Although younger adults could better remember sources of information (Marsh et al., 2005), this did not protect them from being misled. Older adults, being less susceptible to new information, tended to experience an effect the researchers referred to as a “memory illusion” (p. 127), by which they believed they had prior knowledge of a subject and were able to discount the new (and potentially misleading) information more easily. This issue is confounded by the power of partial matches, in which people assign more credibility to information that resembles prior knowledge closely enough for mental heuristics to consider the two pieces of information consistent (Marsh & Umanath, 2014).
The context for the current study was social media, with stimuli resembling Facebook, X (Twitter), and Instagram. In this format, people scroll quickly through many posts and credibility evaluations need to be made quickly. People view the fundamental reliability of social media differently. One strategy people use is to refer to different social media platforms for different types of information (Bashir et al., 2022). Liberals and those who engage with social media more tend to see the platforms as more reliable (Johnson & Kay, 2014). Health information on Facebook is seen as more credible when there is a positively-framed message by a perceived expert with many likes (Borah & Xiao, 2018). The contours of credibility on social media appear consistent with the heuristics discussed above, especially looking at the agency of information by considering its source.
The view taken in the current study reflects the aspects of credibility discussed in the contemporary literature. In this literature, credibility is seen as a form of believability, assessed by the consumer in relation to the features of the novel information as considered alongside other informational resources. The other informational resources may include inter-textuality, personal experience, self-concept, and opinions. Formal, reflective consideration of credibility depends on the consumer recognizing the need to do so and their willingness to commit the cognitive resources. In many cases, perhaps in most online contexts, consumers use heuristics as shortcuts to assess credibility. Given the tendency of information consumers to discount the credibility of materials they disagree with or find discomfiting, it is critical for educators to maximize the credibility of information provided to students. Material on an LMS may have some prima facie credibility advantage compared to social media materials. However, the authors entered into this study in order to understand more about how undergraduates assess the credibility of everyday online material, believing that this could also provide insights into what educational institutions might do to help ensure that their materials meet the credibility criteria.
The Credibility of Resources Encountered Online (CREO) project was conducted in Fall 2022 as an online survey (Sue & Ritter, 2012).
The research questions driving this project were:
The study’s approach was to ask respondents to assess stimuli that varied in design and content for credibility. The variation in content was two-dimensional, including both presentation (as a test of visual credibility) and truth content. As discussed above, truth and credibility may not align. For that reason, the study presented identical stimuli with the wording slightly altered to be non-factual. The degree of truth in the content was varied so that its effect could be quantified and separated from the effects of presentation and medium. The variation in medium was achieved by presenting stimuli in the form of X (Twitter), Facebook, and Instagram posts, creating a three-stage instrument. Designs reflecting these social media were created by a professional communication designer.
The demographic analysis in this study does not include ethnicity. This was a deliberate decision because the most respectful way to address this question in the university used for this study is still being developed, and previous research indicated little variation by ethnic group (Li et al., 2023). A question on primary language was included, but the proportion of respondents choosing a language other than English was too small for language of origin to be included as a factor. In addition, all respondents were studying in English.
The respondents were undergraduates at a medium-sized university in Canada. Each was sent an invitation in early September to participate in an online survey designed for completion on a mobile device or computer. No incentives were provided. There were 1,019 complete responses.
The research team used Lime Survey (www.limesurvey.org) to design and deliver the survey. Lime Survey possesses a number of affordances that proved to be invaluable for this work. The most useful was its ability to randomize stimuli and record which stimulus each respondent received in each of three stages. In total, there were 12 stimuli. This allowed each respondent, when working through the survey, to be presented with a random choice of one out of four stimuli in each stage. In order to make the respondents’ experience more similar to browsing through social media, the stimulus was displayed for 8 seconds and then concealed.
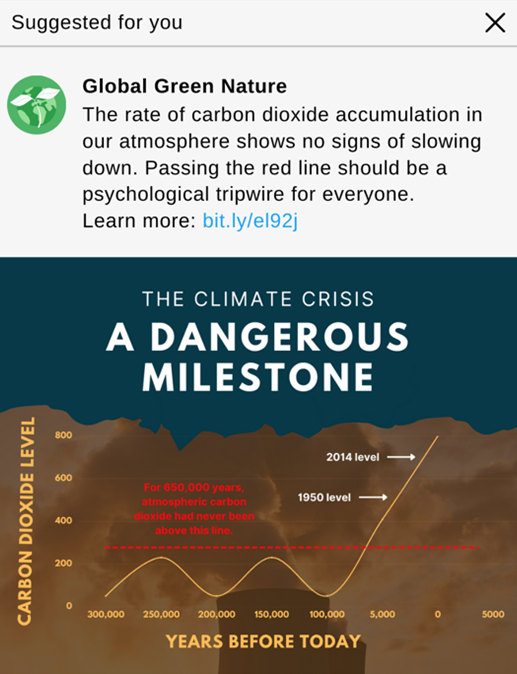
In each round, stimuli could be factual (F) or counter-factual (C), and well-presented (W) or not well-presented (N), creating a four-cell matrix. In addition, the stimuli in each round were designed to be reminiscent of the layout of a particular platform: Twitter (T), Facebook (F), or Instagram (I). The stimulus shown as an example in Figure 1 is FCN: Facebook style, counter-factual, not well-presented. For comparison, Figure 2 is FFW: Facebook style, factual, well-presented. Respondents were not aware that there were four variations of stimulus in the style of each platform and therefore did not know that what they were seeing could be factual or counter-factual, or deliberately badly presented. At the end of the survey, a short text explained which information was factual and counter-factual to prevent respondents being misled.

Respondents were asked basic demographic questions about their age, self-identified gender, year of study, and faculty of study. For each stimulus, they were asked:
These questions were designed to cover the three forms of credibility highlighted in the literature review (medium, source, and content), while also providing a way to consider high-level demographics and the extent to which espoused basis for assessment aligned with actual scores. For example, one group of respondents was shown a well-presented factual post and a second group was shown a badly-presented factual post. If the credibility score was lower for the second, respondents might claim this was because of their previous knowledge or opinion, even though the only change was in the presentation. This would provide important insights into how people judge credibility beyond the truth value of information, since the truth value of the two posts is identical.
For a true experimental design and maximum comparability between stimuli and demographic groups, the same respondents would see each version of a given style of post. The design of the survey precluded this possibility, as respondents would not be viewing each information segment through fresh eyes. Given the effectiveness of Lime Survey in randomizing stimuli and the very similar numbers of respondents being exposed to each, the researchers are confident that the survey design is capable of supporting group comparison. The absolute value of responses is not considered in the analysis because there is no way to know what a credibility score of “30.1/100” actually means. Analysis is based on the differences between scores of different groups exposed to a range of stimuli. In addition, the differences between responses to different post styles (the three platforms) are not a primary focus of analysis, given that the information content varies between them. The topics chosen were politics, climate change, and giant tomatoes, chosen because they were likely to produce different reactions in respondents. It is viable to compare the internal dynamics of scores within each style of post, but not to compare values directly.
The respondents were distributed in a way that reflects the undergraduate population of the medium-sized university reasonably well. Table 1 shows the responses for self-identified gender, where female students are slightly over-represented.
| Self-Identified Gender | Frequency | Per cent |
|---|---|---|
| F | 567 | 59.1 |
| M | 344 | 35.9 |
| X | 48 | 5.0 |
| Total | 959 | 100 |
In terms of age, 86% of respondents were at, or slightly above, traditional undergraduate age. The balance were 25 years-old or above, as shown in Table 2.
| Age Grouping | Frequency | Per cent |
|---|---|---|
| 16-20 | 491 | 50.5 |
| 21-25 | 346 | 35.6 |
| 25+ | 136 | 14.0 |
| Total | 973 | 100 |
Table 3 shows a good spread of respondents across faculties, with the proportional representation strongly consistent with the numbers of students enrolled in each faculty. The responses were combined into five categories for analytical purposes. Professional areas were combined into one group (Business, Education, Nursing, Social Work, Child Care, and Continuing Studies) and Humanities was combined with Fine Arts. This addressed varying numbers of respondents from different areas and allowed for a differentiation between subject areas that explicitly claim to teach critical thinking about textual and visual information and those that do not. In particular, there were low numbers of Fine Arts and Humanities students, reflecting smaller faculties.
| Faculty of Respondents | Frequency | Per cent |
|---|---|---|
| Business/Education/ Nursing/Social Work/Child Care/Continuing Studies | 128 | 13.4 |
| Engineering | 160 | 16.7 |
| Humanities/Fine Arts | 156 | 16.3 |
| Science | 247 | 25.8 |
| Social Science | 266 | 27.8 |
| Total | 957 | 100.0 |
Year of study shows a strong concentration in years 1 to 4 (Table 4). Overall, the respondents appear very typical of the university undergraduate population and are clearly and strongly dominated by people who came of age since the establishment of wide internet access.
| Year | Frequency | Per cent |
|---|---|---|
| 1 | 223 | 23.1 |
| 2 | 210 | 21.7 |
| 3 | 219 | 22.6 |
| 4 | 245 | 25.3 |
| 5 | 62 | 6.4 |
| 5+ | 8 | 0.8 |
| Total | 967 | 100.0 |
The top-level findings are shown in Table 5. Due to the effectiveness of the randomization function, the n’s for each of the 12 columns were strongly consistent at 246 to 278. The differences in each of the score groupings (for example, the four credibility scores in the “Twitter” column) are statistically significant to a high degree (Analysis of Variance, ANOVA, p≤0.001). It is reasonable to be confident that the varying scores do represent varying responses to the stimuli.
| Factual | Counter-Factual | Factual | Counter-Factual | Factual | Counter-Factual | |||||||
| Presentation | Well | Not well | Well | Not well | Well | Not well | Well | Not well | Well | Not well | Well | Not well |
| Code | TFW | TFN | TCW | TCN | FFW | FFN | FCW | FCN | IFW | IFN | ICW | ICN |
| Credibility | 30.1 | 13.7 | 26.1 | 11.9 | 54.8 | 36.8 | 42.7 | 21.8 | 55.7 | 27.1 | 29.4 | 14.5 |
| Source | -30.3 | -65.6 | -32.4 | -61.4 | -1.2 | -48.1 | -2.11 | -49.9 | -11.1 | -48.9 | -31.5 | -61.3 |
| Presentation | -28.7 | -68.2 | -27.9 | -68.3 | 19.8 | -18.0 | 22.1 | -12.7 | 19.5 | -38.2 | -12.6 | -54.7 |
| Knowledge | -11.6 | -27.5 | -27.7 | -35.1 | 38.5 | 23.1 | -10.8 | -37.8 | 4.8 | -8.2 | -15.2 | -31.4 |
| Opinion | -16.8 | -27.1 | -29.0 | -34.6 | 31.85 | 19.1 | -3.8 | -29.0 | 5.9 | -8.6 | -12.6 | -34.4 |
The top-level table provides a number of insights. First, well-presented factual posts (ending in FW) received the highest credibility scores in all three formats even though the absolute scores are not strong (30.1, 54.8, 55.7). Second, badly-presented and counter-factual stimuli (ending in CN) consistently received the lowest scores in all three formats (11.9, 21.8, 14.5). The example in Figure 1 and Figure 2 received credibility scores of 21.8 and 54.8, respectively.
Perhaps the most striking outcome, however, is that in all three formats, well-presented counter-factual stimuli (ending in CW) attained higher credibility scores than badly-presented factual stimuli (ending in FN) (26.1 vs. 13.7, 42.7 vs. 36.8, 29.4 vs. 27.1). In other words, more credibility is lost through bad presentation than through untruthfulness.
The bottom four rows in Table 5 capture the respondents’ subjective rationales for the credibility scores they assigned. The “Source” row in the table is intended to include the elements of agency discussed earlier. Whereas well-presented stimuli were designed to offer “respectable” source names such as “PA Agency,” badly-presented stimuli were posted by users with names like “pugman52093877.” Respondents did not think any of the sources added to the credibility of the stimulus (all mean scores were negative). The scores were generally similar between factual and counter-factual versions of stimuli, but varied between well-presented and badly-presented information. In other words, presentation appears to be linked to source credibility.
The “Presentation” row follows a similar pattern in that the impact of the presentation appears to be somewhat independent of facticity, although in this case, three of the 12 stimuli received positive mean scores. The smallest variation of mean presentation score was 34.8 points (FCW vs. FCN) and the greatest was 57.7 (IFW vs. ICW) on a 200-point scale. It appears people were paying significant attention to presentation and it again made a substantial difference to ascribed credibility.
The “Knowledge” row considers respondents’ previous knowledge, which follows a similar pattern once more. Across the board, respondents indicated their previous knowledge negatively impacted their perception of the credibility of posts, even when the truth value was identical and the sole change was presentation. The differences between the TFW and TFN scores in the “Knowledge” row illustrate this. The well-presented factual post was made less credible by the previous knowledge of respondents (-11.6). The badly-presented post with the same informational content was reported as significantly less credible and the reason given was the respondents’ previous knowledge (-27.5). This pattern continues across all the variations of the table. The only difference is presentation, yet respondents claim their previous knowledge drove their credibility judgment.
The bottom row captures the respondents’ “Opinion.” The decision to add a question about opinion was not simple. Many people rationalize their opinion based on knowledge or other factors, so it was not clear this information would add much to the findings. As can be seen in Table 5, the contours of opinion flow in a similar way to previous knowledge. There seems to be very little tension between the two factors. This finding could usefully be explored further to learn more about whether credibility can be detached from opinion in an online environment.
The results of the analysis by segment are presented in Tables 6 through 9. In each case, ANOVA is used. Only the factors showing a statistically significant difference are included and the usual convention for significance is followed (*= p ≤0.05, **= p ≤0.01). In reviewing these tables, it may be helpful to bear in mind that there were 60 questions in which variance between segments could have become apparent (12 stimuli x five questions). The overall picture in these results is more about consistency than difference.
As Table 6 shows, there were nine questions with statistically significant differences by gender. A clear pattern does not emerge, and in the view of the authors, there is insufficient evidence to argue for consistently different assessments of information credibility by gender.
| Stimulus | Factor | F | M | X |
|---|---|---|---|---|
| TFW | Credibility** | 27.9 | 35.9 | 14.8 |
| TFN | Credibility** | 11.2 | 16.9 | 21.4 |
| TFN | Source* | -68.1 | -65.51 | -49.0 |
| TFN | Presentation** | -73.0 | -67.0 | -50.1 |
| FFW | Opinion* | 36.8 | 24.6 | 14.7 |
| FCW | Opinion** | 3.0 | -10.8 | -30.9 |
| IFN | Credibility* | 24.2 | 32.5 | 24.7 |
| IFN | Source* | -51.7 | -42.5 | 77.0 |
| IFN | Presentation* | -41.3 | -30.9 | -71.6 |
Note. Only factors showing a statistically significant difference are included and the usual convention for significance is followed. (*= p ≤0.05, **= p ≤0.01, ***= p≤ 0.001).
Examining the data by age group showed there are 21 questions with statistically significant differences (Table 7). There are five cases where the oldest age group (25+) gave the lowest scores for overall credibility, though in two of these the stimuli were factual. The oldest group indicated presentation had a stronger effect upon credibility judgment than the younger groups in five cases, though two of these (FFW and IFW) were stimuli designed to be “well-presented.” As they had for presentation, the oldest group ascribed loss of credibility to source in three cases. Knowledge appears four times in Table 7. In three of these cases, the oldest group ascribes significant credibility deductions to previous knowledge, but in one case (TFW), the youngest cohort deducts most for this factor. Finally, opinion is a reason for the oldest group to reduce credibility in four cases.
The data on age cannot be considered conclusive, but in almost half of the cases the older group found the stimuli less credible. In three of those cases, the data was explained by previous knowledge, consistent with the notion of the memory illusion. There may be an indication of a potentially less credible overall perspective from older respondents.
| Stimulus | Factor | 16-20 | 21-25 | 25+ |
|---|---|---|---|---|
| TFW | Knowledge* | -22.0 | -1.52 | -3.47 |
| TCN | Presentation* | -72.1 | -70.6 | -54.6 |
| TCN | Opinion* | -36.6 | -38.3 | -29.9 |
| FFW | Credibility*** | 56.9 | 56.0 | 40.0 |
| FFW | Source* | 4.1 | 0.9 | -19.3 |
| FFW | Presentation** | 26.1 | 23.4 | -1.3 |
| FFW | Knowledge* | 42.2 | 42.4 | 21.2 |
| FFW | Opinion*** | 35.1 | 38.1 | 10.7 |
| FCW | Credibility** | 45.0 | 42.6 | 30.3 |
| FCW | Presentation** | 29.5 | 17.0 | 4.6 |
| FCW | Knowledge* | -4.4 | -13.2 | -31.0 |
| FCN | Credibility** | 22.6 | 25.0 | 11.1 |
| FCN | Source*** | -44.8 | -47.8 | -73.9 |
| FCN | Presentation*** | -8.6 | -1.9 | -50.7 |
| IFW | Credibility*** | 60.0 | 60.0 | 38.8 |
| IFW | Source** | 19.9 | 15.4 | -21.1 |
| IFW | Presentation*** | 27.1 | 23.8 | -3.6 |
| IFW | Knowledge*** | 8.6 | 8.0 | -13.1 |
| IFW | Opinion** | 7.9 | 10.6 | -9.6 |
| IFN | Opinion* | -5.2 | -11.2 | -22.7 |
| ICW | Credibility* | 31.1 | 31.8 | 20.2 |
Note. Only factors showing a statistically significant difference are included and the usual convention for significance is followed. (*= p ≤0.05, **= p ≤0.01, ***= p≤ 0.001).
There are seven variations in response by year of study, as shown in Table 8. In advance of the data, it would have been reasonable to expect evidence of changes from year to year. For example, respondents could have applied their knowledge more substantially or been more confident about their opinion. The results, however, do not reflect any such idea in a systematic way. There are very few significant variations by year of study and those do not appear to reflect a strong pattern.
| Stimulus | Factor | 1 | 2 | 3 | 4 | 5 |
|---|---|---|---|---|---|---|
| TFN | Presentation** | -67.0 | -59.0 | -71.6 | -77.3 | -71.3 |
| TFN | Knowledge* | -24.0 | -14.9 | -20.5 | -44.0 | -36.4 |
| TCW | Knowledge** | -48.8 | -30.2 | -12.2 | -22.8 | -39.9 |
| TCN | Opinion* | -43.5 | -39.7 | -32.2 | -23.3 | -53.4 |
| FCW | Knowledge* | 10.0 | -21.0 | -11.4 | -21.5 | -15.8 |
| FCN | Opinion* | -24.4 | -41.0 | -31.5 | -24.0 | -1.3 |
| ICN | Opinion* | -35.7 | -38.6 | -37.3 | -34.2 | 3.07 |
Note. Only factors showing a statistically significant difference are included and the usual convention for significance is followed. (*= p ≤0.05, **= p ≤0.01, ***= p≤ 0.001).
Finally, Table 9 shows the four significant variations by faculty. One observation is the way in which the professional faculties (Business, Education, Social Work, Nursing, Child Care, and Continuing Education) position their previous knowledge as an influence on FFN (the stimulus concerned global warming). In the next row, respondents from the Engineering faculty indicate that their opinion reduces the credibility of the stimulus very slightly—an interesting result given that the stimulus is factual. However, there is little sign of an emergent pattern.
| Stimulus | Factor | B/Ed/SW | Eng | Hum | Sci | SSci |
|---|---|---|---|---|---|---|
| FFN | Knowledge** | 1.1 | 8.4 | 31.2 | 35.2 | 26.7 |
| FFN | Opinion** | 10.6 | -1.0 | 27.7 | 31.4 | 22.3 |
| ICW | Credibility* | 20.6 | 37.6 | 33.1 | 29.9 | 30.7 |
| ICN | Credibility* | 11.9 | 8.7 | 18.4 | 12.0 | 16.5 |
Note. B/Ed/SW: Business/Education/Nursing/Social Work/Child Care/Continuing; Eng: Engineering; Hum: Humanities/Fine Arts; Sci: Science; SSci: Social Science. Only factors showing a statistically significant difference are included and the usual convention for significance is followed. (*= p ≤0.05, **= p ≤0.01, ***= p≤ 0.001).
The data indicate a strong overall pattern that seems largely unaffected by the demographic factors considered in this study.
The discussion reflects the four research questions identified earlier.
Facticity proved to be a significant factor in the assignment of credibility to stimuli. There are differences between factual and counter-factual posts, whether they are well or badly presented. Given the range of topics in the stimuli (politics, climate change, and big tomatoes), the authors were impressed by the ability of respondents to judge truthfulness in 8 seconds.
Presentation is a significant factor in assessment of credibility. Factual content badly presented lost considerable credibility and the same was true for counter-factual content. Looking across Row 1 (Means) of Table 5, the gross numerical score drops were greater than drops from truth value (compare for example, TFW-TFN= 16.4 and TFW-TCW= 4.0). At first glance, bad presentation appears to lead to lower credibility scores than untrue content. If posts are both counter-factual and badly-presented, they receive the lowest score of all.
Gender appears to have limited effect on credibility judgments and the particular factors respondents identify as having an influence. There is some suggestion in the data that age group may have a potential influence, though the data is far from conclusive. This is an area that would benefit from further investigation.
The faculty and year of study appeared to make little difference to the credibility scores assigned by respondents. This is an important outcome. If claims about higher education providing tools for people to help them make informed decisions about online materials were true, it would be expected to show up in this data. However, the earlier discussion about people using heuristics when reflective analysis is not required may explain these results to some extent. Social media, and even more so, social media within a survey, may not be considered significant enough to move beyond heuristics.
This question can be addressed by considering what happened in the data when presentation was designed to be poorer without changing the facticity of the stimulus. First, the credibility of the post dropped (as seen by comparing xFW to xFN scores across Table 5). This reflects the discussion under Question 2 above. Respondents demonstrated a level of self-awareness about this, in that both source and presentation scores dropped. However, in every case, across the table, respondents said they found the badly-presented stimulus less credible based on their previous knowledge and opinion (compare for example, the knowledge and credibility rows of Table 5 between FFW and FFN). Bear in mind that only presentation changed.
This is also an important finding. It suggests that respondents make decisions based on presentation and then ascribe their responses to knowledge and opinion. The implication is that aesthetic and cognitive judgment are deeply connected in social media, and potentially in other online spaces. People will, in effect, backfill cognitive rationales to support a judgment that can only be based on presentation, as suggested in the literature review.
This can be given further nuance by again considering the analysis based on age group. In two cases (FFW and IFW), the oldest cohort assigned the least credibility to stimuli that were both factual and well-presented (Table 7). In these two cases, the oldest cohort also identified knowledge and opinion as much stronger drivers of their judgment than the other two age groups. This is open to different interpretations. On the one hand, independence of thought is to be prized. On the other, the findings suggest that older cohorts may be more vulnerable to being led astray by their own perceptions. This has important implications for online education, as discussed in the conclusion.
Overall, there are important confirmations of previous work within this data, as well as a novel insight. The data demonstrate that undergraduate students at a mid-sized university are adopting approaches to credibility that resonate strongly with broader work on credibility assessment. The first notable feature is the extent to which the participants can judge the truth of information. The researchers were impressed with the consistency by which the well-presented factual posts were differentiated from the badly-presented counter-factual posts. One has to bear in mind that different groups of people saw the four conditions of each post, so they judged them without having a comparator.
The broad lack of consistent credibility differentiation by gender, age, area of study, and year of study suggests that educators and others cannot assume that the identity characteristics of information consumers affect their attribution of credibility in any consistent way. Working with adults over 25 years of age may present particular complications. There is some indication that credibility is less easily won from this group than from lower age groups. The findings also suggest that the older cohort relies more on opinion and prior knowledge to dismiss factual content as counter-factual. This set of data does not give rise to a simple or inclusive dynamic.
The significance of presentation is notable. The consistency with which well-presented counter-factuals were seen as more credible than badly-presented truths is striking. Again, this is a result that could have been predicted from the literature, but the consistency was not an aspect the researchers anticipated. The dominance of presentation is underlined by the number of cases in which people claimed to be drawing on knowledge or opinion even though only the presentation had changed from a much more highly-rated post with identical content. Given the data, the authors suggest that it may be helpful to consider presentation as a form of heuristic alongside those mentioned earlier. There is some indication that source is not assessed separately from presentation, and the parallels between the two suggest that presentation is a heuristic for source credibility, which as described in the literature review, is in turn the predominant means of assessing content credibility.
The authors wish to sum up the most powerful message arising from this research by returning once more to the quote from Keats in the title of the paper. For the respondents to this survey, there is a great deal of accuracy to the notion that beauty is truth (Keats, 2023). The challenge for those who wish to gain the greatest credibility in the coming years will be ensuring the presentation of online education matches the truths to be found there.
There are two important limitations to this study to bear in mind. The first is the population. All respondents were enrolled in undergraduate programs at a single medium-sized Canadian university, so the findings may be limited in terms of generalization to wider populations. The second is the context of the survey, in particular the limited knowledge about how LMS differ from social media in terms of credibility assessment factors. These limitations are discussed in the following section on further research.
The current study strongly suggests four areas that would benefit from further enquiry. First, the influence of the LMS environment and the extent to which findings from social media can be applied to those systems needs to be better understood. Second, further exploration is needed on the nuances of older adults interacting with online materials and how that is influenced by an official source such as an LMS. Third, more research is needed on the effects of ethnicity and language on credibility. Fourth, there is a need for deeper understanding of the effects of presentation, particularly the details of the interaction of multi-modal presentation and learning (mediated by credibility). It seems important to know whether better presentation translates to better learning, and to understand the limits of this relationship.
The authors acknowledge and appreciate the support of the university in which the study took place. The Registrar’s Office was particularly helpful in making sure the invitation to participate reached undergraduates at a busy time of year for all involved.
We acknowledge and respect the lək̓ʷəŋən peoples on whose traditional territory the University of Victoria stands and the Songhees, Esquimalt, and W̱SÁNEĆ peoples whose historical relationships with the land continue to this day.
American Psychological Association. (2023). Learning. In APA dictionary of psychology. https://dictionary.apa.org/learning
Bashir, I., Malik, A., & Mahmood, K. (2022, June 29). Measuring personal and academic differences in students’ perceived social media credibility. Digital Library Perspectives, 38(3), 251-262. https://doi.org/10.1108/DLP-06-2021-0048
Borah, P., & Xiao, X. (2018). The importance of ‘likes’: The interplay of message framing, source, and social endorsement on credibility perceptions of health information on Facebook. Journal of Health Communication, 23(4), 399-411. https://doi.org/10.1080/10810730.2018.1455770
Bråten, I., Braasch, J. L. G., Strømsø, H. I., & Ferguson, L. E. (2015). Establishing trustworthiness when students read multiple documents containing conflicting scientific evidence. Reading Psychology, 36(4), 315-349. https://doi.org/10.1080/02702711.2013.864362
Buhlmann, H., & Gisler, A. (2006). A course in credibility theory and its applications. Springer Publishing.
Fogg, B. J., Soohoo, C., Danielson, D. R., Marable, L., Stanford, J., & Tauber, E. R. (2003, June). How do users evaluate the credibility of Web sites? A study with over 2,500 participants. In Proceedings of the 2003 conference on designing for user experiences (DUX '03) (pp. 1–15). Association for Computing Machinery, New York. https://doi.org/10.1145/997078.997097
Greene, J. A., Copeland, D. Z., Deekens, V. M., & Freed, R. (2018). Self-regulated learning processes and multiple source use in and out of school. In J. L. G. Braasch, I. Bråten, & M. T. McCrudden (Eds.), Handbook of multiple source use, (pp. 320–338). Routledge. https://doi.org/10.4324/9781315627496
Hämäläinen, E. K., Kiili, C., Räikkönen, E., & Marttunen, M. (2021). Students’ abilities to evaluate the credibility of online texts: The role of internet-specific epistemic justifications. Journal of Computer Assisted Learning, 37(5), 1409–1422. https://doi.org/10.1111/jcal.12580
Herrero-Diz, P., Conde-Jiménez, J., & Reyes de Cózar, S. (2020). Teens’ motivations to spread fake news on WhatsApp. Social Media + Society, 6(3), 1–14. https://doi.org/10.1177/2056305120942879
Johnson, T. J., & Kaye, B. K. (2014, July 1). Credibility of social network sites for political information among politically interested internet users. Journal of Computer-Mediated Communication, 19(4), 957–974. https://doi.org/10.1111/jcc4.12084
Kang, B., O’Donovan, J., & Höllerer, T. (2012). Modeling topic specific credibility on Twitter. In Proceedings of the 2012 ACM international conference on intelligent user interfaces (pp. 179–188). Association for Computing Machinery. https://doi.org/10.1145/2166966.2166998
Keats, J. (2023). Ode on a Grecian urn and other poems. Poetry Foundation. https://www.poetryfoundation.org/poems/44477/ode-on-a-grecian-urn
Kiili, C., Coiro, J., & Räikkönen, E. (2019). Students’ evaluation of information during online inquiry: Working individually or in pairs. Australian Journal of Language and Literacy, 42, 167–183. https://doi.org/10.1007/BF03652036
Kim, C. & Brown, W. J. (2015, December). Conceptualizing credibility in social media spaces of public relations. Public Relations Journal, 9(4). https://prjournal.instituteforpr.org/wp-content/uploads/2016v09n04KimBrown.pdf
Kohnen, A. M., Mertens, G. E., & Boehm, S. M. (2020). Can middle schoolers learn to read the web like experts? Possibilities and limits of a strategy-based intervention. Journal of Media Literacy Education, 12(2), 64–79. https://doi.org/10.23860/JMLE-2020-12-2-6
Li, J., Kuutila, M., Huusko, E., Kariyakarawana, N., Savic, M., Ahooie, N. N., Hosio, S., & Mäntylä, M. (2023). Assessing credibility factors of short-form social media posts: A crowdsourced online experiment. In Proceedings of the 15th biannual conference of the Italian SIGCHI chapter, Torino, Italy (pp. 1–14). https://doi.org/10.1145/3605390.3605406
Marsh, E. J., Balota, D. A., & Roediger, H. L., III. (2005). Learning facts from fiction: effects of healthy aging and early-stage dementia of the Alzheimer type. Neuropsychology, 19(1), 115–29. https://doi.org/10.1037/0894-4105.19.1.115
Marsh, E. J., & Umanath, S. (2014). Knowledge neglect: Failures to notice contradictions with stored knowledge. In D. N. Rapp & J. L. G. Braasch (Eds.), Processing inaccurate information: Theoretical and applied perspectives from cognitive science and the educational sciences (pp. 161–180). MIT Press.
Martin, K. N., & Johnson, M. A. (2010). Digital credibility and digital dynamism in public relations blogs. Visual Communication Quarterly, 17(3), 162-174. https://doi.org/10.1080/15551393.2010.502475
Metzger, M. J., & Flanagin, A. J. (2013, December). Credibility and trust of information in online environments: The use of cognitive heuristics. Journal of Pragmatics, 59(Part B), 210–220. https://doi.org/10.1016/j.pragma.2013.07.012
Mphahlele, R. S., Makgato-Khunou, P., Tshephe, G., Sethusha, M. J., Tshesane, M. M., Wright, R., & Denzil, C. (2023). First-year student’s e-readiness to use learning management system: COVID-19 realities. International Journal of E-Learning & Distance Education, 38(1). https://doi.org/10.55667/10.55667/ijede.2023.v38.i1.1266
Perfetti, C. A., Rouet, J.-F., & Britt, M. A. (1999). Towards a theory of documents representation. In H. van Oostendorp, & S. R. Goldman (Eds.), The construction of mental representations during reading (pp. 99–122). Erlbaum.
Rosenblatt, L. M. (1982). The literary transaction: evocation and response. Theory Into Practice, 21(4), 268–277. http://www.jstor.org/stable/1476352
Rouet, J.-F., Saux, G., Ros, C., Stadtler, M., Vibert, N., & Britt, M. A. (2021). Inside document models: Role of source attributes in readers’ integration of multiple text contents. Discourse Processes 58(1), 60–79. https://doi.org/10.1080/0163853X.2020.1750246
Salmerón, L., Kammerer, Y., & Delgado, P. (2018). Non-academic multiple source use on the Internet. In J. L. G. Braasch, I. Bråten, & M. T. McCrudden (Eds.), Handbook of multiple source use (pp. 285–302). Routledge. https://doi.org/10.4324/9781315627496
Schul, Y., & Mayo, R. (2014). Discounting information: When false information is preserved and when it is not. In D. N. Rapp, & J. L. G. Braasch (Eds.), Processing inaccurate information: Theoretical and applied perspectives from cognitive science and the educational sciences, (pp. 203–221). MIT Press.
Shabani, A. & Keshavarz, H. (2022). Media literacy and the credibility evaluation of social media information: Students’ use of Instagram, WhatsApp and Telegram. Global Knowledge, Memory and Communication, 71(6/7), 413431. https://doi.org/10.1108/GKMC-02-2021-0029
Sue, V. M., & Ritter, L. A. (2012). Conducting online surveys (2nd ed.). SAGE Publications. https://doi.org/10.4135/9781506335186
Ralf St. Clair is Professor in the Department of Curriculum and Instruction, Faculty of Education, University of Victoria, Canada. His interests are adult and higher education, including policy and learning theory.
Maryam Shirdel Pour is an MA student in the Department of Curriculum and Instruction, Faculty of Education, University of Victoria, Canada. Her interests are inquiry-based learning, digital literacy, and technology-integrated learning design.
James Nahachewsky is Dean of the Faculty of Education at the University of Regina. His research examines the impact of young peoples’ emergent digital-based critical literacy practices on teaching and learning, and multi-literacies’ pedagogy within Holocaust and Human Rights education.
The authors report there are no competing interests to declare.
Miss Jayla-Lee Smythe: This is AMAZING people! The rate of carbon dioxide in our atmosphere has STABILIZED during the past couple of months thanks to OUR global effort. WE ARE DOING IT!!!!! #climatechange #positive #hopeful. The Earth’s Climate: A Hopeful Turn graph shows carbon dioxide level over years before today with a levelling off at 2014 and a slight downward turn toward 2022.
Global Green Nature: The rate of carbon dioxide accumulation in our atmosphere shows no signs of slowing down. Passing the red line should be a psychological tripwire for everyone. Learn more: bit.ly/e92. The Climate Change: A Dangerous Milestone graph shows carbon dioxide level over years before today with a sharp increase from 100,000 years before today to 2014 and beyond.