VOL. 15, No. 2, 17-36
This article explores the relationship between learners' sociodemographic characteristics and their level of participation in computer conferencing. A quantitative study of participation among 30 learners in a noncredit agricultural leadership development program provides the empirical data for this exploration. The relationships between learner participation and six sociodemographic variables are explored: sex, age, education level, occupation, residence in urban or rural areas, and region of residence in Canada. Holding a university degree and living in an urban area are found to be the strongest predictors of participation. Recognizing that a considerable amount of variability in learners' participation in computer conferences may reflect those learners' sociodemographic characteristics has important implications for the design and facilitation of such conferences.
Cet article explore les relations entre les caractéristiques socio-démographiques des apprenants et leurs niveaux de participation aux conférences télématiques. Une étude quantitative de la participation de trente personnes à un programme non-crédité de développement du leadership en agriculture constitue les données empiriques de cette recherche. Les relations entre les apprenants, leurs participations et six variables socio-démographiques sont analysées : le sexe, l'âge, le niveau d'éducation, l'occupation, le milieu urbain ou rural et le lieu de résidence au Canada. Les variables « possédant un diplôme universitaire » et « résidant en milieu urbain » sont les prédicteurs les plus susceptible d'une participation positive des apprenants. Reconnaître que la grande variabilité de la participation des apprenants aux conférences télématiques peut découler de leurs caractéristiques socio-démographiques a des implications importantes dans la planification de telles conférences.
Computer conferencing is emerging as an important medium for distance education (Garrison, 1997). The relative advantages of this medium to facilitate learning at a distance include the opportunity for ongoing contact between participants, which offsets the isolation often cited as a primary disadvantage of traditional, independent study programs (Bullen, 1998). Computer-mediated communications technologies, creatively applied, can overcome the isolation of traditional distance education by “incorporating into the course activities which specifically require student initiative, student discussion, student reflection, or iterative attempts to improve one’s work” (Davie & Wells, 1991, p. 15). In addition to increased opportunities for learners to interact with one another, computer conferencing potentially reduces learners’ dependence on an instructor. Harasim (1987) reports instructor contributions in a computer conference environment as low as 10% to 15% compared with 60% to 80% of oral interaction being monopolized by instructors in traditional face-to-face settings. Because learners talking more and instructors talking less has long been associated with increased student learning, a greater proportion of communication coming from learners probably indicates a positive development rather than an abdication of instructor responsibilities.
Opportunities for increased interaction through active participation in a computer conferenced learning environment have additional benefits. Empowerment, as described by Davie and Wells (1991), can be realized by “the expectation and enabling of a student to take a visible and meaningful role in the electronic classroom” (p. 16). Benefits of such empowerment through active participation include increased potential for the development of critical thinking skills (Davie & Wells, 1991; Garrison, 1997), better access to group knowledge, and increased motivation (Harasim, Hiltz, Teles, & Turoff, 1997). Another benefit to be gained by using the opportunities for increased participation in computer conferences is the increased potential to build a community of learners (Palloff & Pratt, 1999). Designing online exercises that foster collaborative learning can help to establish an environment where individual contributions are directed toward group efforts (Davie & Wells, 1991) and the establishment of a sense of belonging (Eastmond, 1995; Palloff & Pratt, 1999). Finally, the particular characteristics of the medium of computer conferencing create unique opportunities for participation not found elsewhere. For example, every learner has the opportunity to engage in the dialogue without regard for the structures of time and space (Harasim et al., 1997). Also, unlike the traditional classroom, more verbose participants are not as easily able to dominate the conversation. Some have speculated that less assertive and more reflective learners find it easier to participate in discussions and that the interaction that takes place in a computer conferenced learning environment is qualitatively better than in the traditional classroom (Harasim, 1987, 1990, 1995).
Because participation is a prerequisite to maximizing learning in computer conferenced environments, it is critical to examine the nature of online participation. It is obvious that computer conferencing design and facilitation need to incorporate strategies that increase overall rates of participation among learners (Mercer, 1994; Paulsen, 1996). However, designers and facilitators also need to pay attention to the quality of learner contributions and to the equity of contributions among different participants. This article is based on our experiences designing and delivering the online component of the Canadian Agriculture Lifetime Leadership (CALL) program. As is described more fully below, the computer conferencing component of the CALL program was characterized by an uneven level of participation among its 30 learners. Because a fairly uniform degree of participation would seem to be more conducive to learning among all participants in a computer conference, we became interested in understanding the variability in rates of online participation among our learners.
Much existing literature on computer conferencing participation focuses on pedagogical interventions and counseling strategies for improving participation rates (Davie, 1989; Feenberg 1993; Paulsen, 1996). However, this literature does not adequately explain the factors influencing differential participation rates among learners (Bullen, 1998). In his review of such literature, Bullen identifies three categories of factors affecting learners’ computer conferencing participation: the inherent attributes of computer conferencing, the design and facilitation of computer conferencing, and student dispositional and situational factors. Bullen’s list of dispositional factors includes learners’ attitudes toward computer conferencing and the subject of the conference, computer and computer conferencing skills, degree of comfort with the medium of communication and the epistemological orientation of the course, and motivation. His list of situational factors includes learners’ access to needed hardware and software, time available for study, and general (home) learning environment. An earlier study by Ross, Crane, and Robertson (1995) also identified computer skills and technical problems as key barriers to equity of access to computer conferencing.
Although dispositional and situational factors are undoubtedly important, do they really give distance education practitioners and scholars a full understanding of why different learners vary so much in their participation? Are differences between learners the result of personal differences in factors such as motivation, learning style, or skill level? Or do the cultural and pedagogical structures of computer conferencing favor the participation of learners who have certain social or demographic characteristics? This article uses an empirical study of 30 learners in a 20-month computer conference to explore the relationships between the sociodemographic characteristics of learners and their varying levels of computer conferencing participation.
The range of sociodemographic variables considered in this article is limited by the characteristics of the learners in the computer conference that served as its focus. As described more fully in the subsequent section, the 30 learners whose computer conferencing participation is explored in this article shared a number of important characteristics. They were all actively employed in agriculture or the agri-food industry. They all had the social and economic resources to take part in a two-year leadership development program with an annual tuition fee of $2,500, and they all had the intellectual and social skills to have been selected to a program where the competitive recruitment process attracted over 140 applicants from across Canada. In addition to these common characteristics that were defined by the parameters of the CALL program, all 30 participants also happened to be Canadian citizens of European ethnic heritage.
Despite similarities of occupational sector, socioeconomic status, and ethnicity, this group of learners presents an interesting opportunity to explore the influence of a range of other sociodemographic characteristics on learners’ computer conferencing participation. Are there differences between the participation rates of male and female learners; younger and older learners; learners with relatively more or less formal education; learners residing in rural or urban areas; farmers and learners with other principal occupations; learners from the different regions of Canada? These are important questions for computer conference designers and facilitators, because if such sociodemographic characteristics shape learners’ levels of participation, then the design and facilitation of computer conference learning environments should be sensitive to such characteristics. For example, if individual learners’ level of active participation in computer conferencing can be predicted from their sociodemographic characteristics, then more intensive facilitation techniques can be designed for those learners at the start of a course or program.
The unique group of learners that provide the participants for our empirical research enhances the focus of this article on the relationships between sociodemographic characteristics and computer conferencing participation. Many existing studies exploring the pedagogical application of computer conferencing used university students enrolled in degree credit courses as the subjects of their research. For example, Bullen (1998) suggests that sex, age, and education level were observed to have an impact on the level of participation among learners in his study. However, he was unable to analyze the impact of such variables rigorously because of the small number of participants in his study (n=13) and because the participants were fairly homogenous. The 30 participants of the current study were neither conventional university students nor homogenous. The CALL participants were adult learners enrolled in a noncredit leadership development program. Therefore, beyond the moral suasion of peers and facilitators, there was virtually no compulsion for anyone to take part in the computer conference. Participating more or less in conferencing activities did not have the instrumental benefit for participants—such as a higher grade in their course—often associated with distance education for traditional university students. In other words, although participation in the computer conference was understood to be an expectation of the program, there was no extrinsic motivation to participate actively. It should be noted that the participants in this computer conference were all fully employed adult learners; their computer conferencing activities were undertaken in the context of already busy lives. Understanding the determinants of participation of such groups of adult learners is important, because as Kanuka and Anderson (1998) assert, computer conferencing is rapidly becoming a popular tool for continuing professional education.
In the next section we briefly describe the objectives and structure of the program of which the learners form the participants of this article. We then describe the computer conference and its participants in more detail. After describing our research methods, we discuss our findings with regard to participation in the computer conference. We document that there was substantial variability in the range of participation between learners, and then we explore the extent to which such variability reflected those learners’ sociodemographic characteristics. We conclude by identifying implications for the study and practice of computer conferencing applied to learning contexts.
The mission of the CALL program is to develop effective leaders for the Canadian agriculture industry. The University of Saskatchewan Extension Division, in partnership with the Canadian Farm Business Management Council and Agriculture and Agri-Food Canada, delivered the initial pilot cohort of the CALL program from September 1997 through May 1999. Thirty learners from across Canada were selected for the program, the curriculum of which was built around three pillars: broadening horizons of knowledge in leadership and agricultural issues, practicing the arts of leadership, and building effective networks. Six face-to-face seminars and an ongoing computer conference were the basic delivery strategies used in the program. The face-to-face seminars were distributed between November 1997 and March 1999 and took participants to six Canadian provinces, three of the United States, and Mexico.
Whereas the face-to-face seminars required learners to take part in about 45 days of full-time study, the CALL computer conference expected learners to devote about five hours of work per week throughout the 18 months of the program. Computer conferencing served the CALL program in three ways. First, it supported the face-to-face elements of the program by providing opportunities for ongoing learner interaction between the in-person seminars and a forum through which to orient learners to forthcoming seminars and to debrief past seminars. Second, it served as a medium for participants to build knowledge and skills related to agricultural leadership. Third, participating in the conference itself served to enhance learners’ abilities to use new information technologies for purposes of leading organizations.
The CALL computer conference, which used the FirstClass conferencing software, was divided into a number of subconferences. For purposes of our analysis in this study, we categorized the various subconferences into three types: social, academic, and information exchange. The social function of the computer conference revolved around the “Café.” The Café subconference operated throughout the duration of the program and was designed to encourage the building of interpersonal rapport and to strengthen the development of a network of learners. Learners were encouraged to use the Café subconference for a wide range of personal and professional information sharing.
Five academic subconferences operated at different times. The Issues Analysis Project subconference existed over virtually the entire duration of the program. The three core goals of this project were to build knowledge of important issues in the Canadian agriculture industry; to practice key leadership skills such as communication, working in groups, and critical thinking; and to share the results of the exercise through both oral and written reports. At the initial face-to-face seminar of the program, the 30 learners divided themselves into seven working groups organized around an issue of national importance for agriculture in Canada. Each group worked on its chosen issue—such as education, public policy, globalization, biotechnology, or marketing—through a process of gathering and assessing information, creating and critiquing ideas, and preparing and revising reports. Each group had its own working subconference, and all groups shared an IAP Forum where they could post information and progress reports of interest to other groups. In addition to online work, some time was devoted at each of the face-to-face seminars for groups to work on their Issues Analysis Projects.
The Current Events Forum and the Leadership Challenge Discussion Area operated from November 1997 through June 1998. The Current Events subconference was designed to raise awareness of contemporary agricultural and nonagricultural issues from different regions and sectors of Canadian agricultural activity. For the purposes of this subconference, learners were grouped into four regional teams (Atlantic, Central Canada, Prairie Provinces, and West). On a rotating weekly basis, each team was responsible for posting information and facilitating discussion concerning key regional issues facing the agri-food industries. Each regional team had a working subconference in which to organize their postings, and the four teams shared the Current Events Forum for postings and public discussion. The Leadership Challenge Discussion Area was a subconference to which all learners were encouraged to contribute their reflections and insights about the core leadership textbook used in the course (Kouzes & Posner, 1995). The discussion in this subconference was structured in part by questions posted by the CALL Program Manager concerning each of the chapters in the textbook.
After a midsummer break in computer conferencing activities, and as a result of feedback from a formative evaluation instrument, a Key Issues Forum replaced the Current Events Forum. From September 1998 through the end of the program, the Key Issues Forum provided a subconference for individual learners to post information and discuss issues that they thought were important to agriculture in Canada. The major difference between the key issues discussion and the preceding current events discussion was that the Key Issues subconference was not structured by regional teams with formal responsibilities for posting messages according to a defined schedule. The final academic subconference in the CALL computer conference was the Visioning Project, which began in October 1998 and ended in March 1999. The Visioning Project challenged the CALL participants to define and communicate a shared vision for the future of the agriculture industry in Canada. Online work made a modest contribution to the successful completion of this project, with the most intensive visioning work accomplished at the three face-to-face seminars in the second year of the program.
The final category of subconferences in the CALL computer conference related to the exchange of various types of information that could not easily be categorized as specifically academic or social. The Preparation/Debriefing subconferences were designed to enable learners to maximize their benefits from the six face-to-face events through providing information about forthcoming events and creating a forum for the discussion of past events. The CALL Web subconference was designed to encourage the development of effective skills in accessing and assessing information from the Internet and to broaden learner awareness of contemporary issues and available online resources relevant to agriculture. The Info Depot subconference was a bulletin-board space for posting information of interest to CALL participants, and it included a help function. Finally, the general CALL Conference area was used to post announcements.
Data for this study were obtained through an unobtrusive review of the archive from the entire CALL computer conference. Informed consent was obtained from all participants before data collection started. The conference itself took place from October 1997 through May 1999. Over the course of the computer conference, regular housekeeping was conducted to delete trivial messages (such as one-word responses to existing messages) and archive all other messages. In the summer of 1999 each individual message that had been archived over the course of the entire conference was categorized according to (a) the identity of the sender, (b) the month it was sent to the conference, and (c) the subconference to which it was sent. This categorization was then transferred to a spread sheet, and the data were compiled and analyzed using the Statistical Package for the Social Sciences (SPSS). Contributions from program facilitators and organizers were excluded from data analysis.
The research methods used in this study have several limitations. First, we have only a quantitative indication of participation levels in the computer conference. We use the number of messages written and sent by individuals as the measure of their participation in the conference. Such an approach cannot capture meaningful qualitative differences in length, thoughtfulness, or other characteristics of different individuals’ participation. Despite our deletion of trivial messages from the conference archive, substantial variation exists in the quality of different messages where submission counts as one message in our analysis. Second, we have included only messages sent to public areas in our analysis. We were not able to measure two other important types of participation in this computer conference: private e-mail messages sent between participants or between participants and the conference facilitators, and synchronous chats between participants. Third, we have made no effort to measure “lurking,” or the extent to which learners participated in the conference by reading other participants’ messages but did not respond with messages of their own. Despite these limitations, we are confident that the crude number of messages sent by learners provides a reasonable estimate of their level of participation in the CALL computer conference.
Although levels of statistical significance are reported in the findings from this study, readers should use caution when generalizing our results to other populations of learners. The 30 participants were not randomly selected. Rather, they were purposely selected because of their potential to contribute significantly to the leadership of businesses and organizations in agriculture. In addition, the relatively small sample size (n=30) limits the power of the tests of statistical significance used in the analysis. Therefore, in the analysis we comment both on relationships that have statistical significance and on those that would appear to have a practical importance, although not statistical significance.
Sixteen men and 14 women participated in the first CALL cohort. Six of these participants were from Atlantic Canada; four from Ontario; three each from Quebec, Manitoba, and British Columbia; six from Saskatchewan; and five from Alberta. Most major agricultural commodities produced in Canada were represented by at least one participant in the CALL program: grains and oilseeds, cattle, dairy, hogs, poultry and eggs, greenhouse production, specialty crops, and potatoes. Although the CALL participants had diverse backgrounds, they shared in common past experience and current commitment to serving as leaders with farms, agri-businesses, .nongovernmental organizations, and rural communities. Farming was the principal occupation of 16 of the participants, and the other 14 worked for businesses or nongovernmental organizations in the agriculture sector. Six learners resided in cities, whereas 24 lived in rural areas.
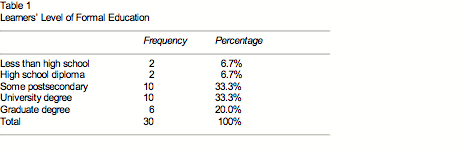
Table 1 indicates the level of formal education obtained by the 30 learners in the CALL program, and Table 2 indicates their approximate ages.
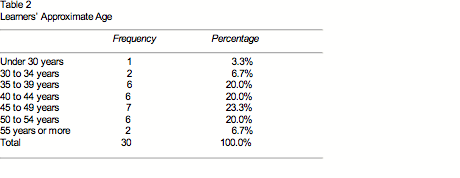
Sixteen learners in the program had graduated from university, and 14 had not. One-half of learners were younger than 45 years of age, and one-half were older.
Table 3 indicates the overall level of participation by the 30 learners in the CALL computer conference.
The final row in Table 3 refers to all of the messages that were sent by learners to the computer conference. The first three rows divide this overall participation into the three categories of subconferences defined above. The two columns at the left of Table 3 indicate the overall number of messages sent to each category of subconferences and the mean number of messages sent by each of the 30 learners to these subconferences. Of the total number of messages, 48.1% were sent to academic subconferences, 33.7% to the Café, and 18.2% to information exchange subconferences. Given that the CALL computer conference lasted for 20 months, the average level of participation was just under five messages per month per learner.
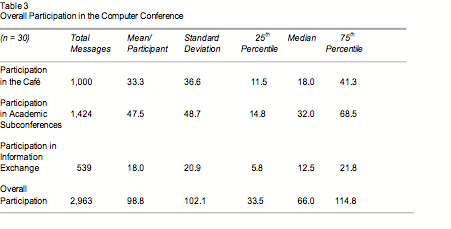
The number of messages exchanged varied somewhat each month, but participation in the computer conference was relatively stable over time. The highest concentration of messages (888 or 30%) was sent during the last four months of the program. There was a strong correlation between learners’ participation in each of the three categories of subconferences. The Pearson correlation coefficients with regard to overall participation were .953 for the Café, .972 for the academic subconferences, and .956 for the information exchange subconferences. The lowest correlation between any two types of subconferences was .864 for the participation in the Café and the academic subconferences. This means that there was a strong likelihood that those learners who contributed relatively few (or many) messages to any one type of subconference would also have sent relatively few (or many) messages to the other subconferences. For purposes of presenting further data, we use only the overall participation rates, because these rates are such strong predictors of the rates of participation in each of the three different categories anyway. We found no meaningful differences with regard to specific sociodemographic characteristics being associated with differential participation across the three categories of subconferences.
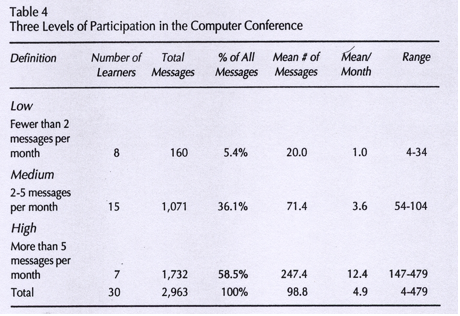
The four columns at the right of Table 3 indicate substantial variability between the level of participation of different learners in the computer conference. The 25th and 75th percentile scores indicate that one quarter of participants sent fewer than 34 messages, whereas another one quarter of participants sent more than 114 messages. The large size of the standard deviation scores in comparison with the means, and the fact that each median score is substantially lower than the mean, indicate that a relatively small number of highly active participants contributed many messages, whereas most participants contributed fewer than the mean number of messages. Table 4 divides the 30 learners into three categories based on their overall level of participation.
Table 4 clearly indicates substantial differences in the level of participation of different learners. Seven high-end users contributed nearly 60% of all messages to the computer conference and sent on average over 12 messages per month. At the other extreme, eight low-end users sent an average of only one message per month. How can we understand the vast differences between levels of participation in this computer conference? Are such differences merely the reflection of idiosyncratic differences in motivation, learning styles, or receptivity to computer conferencing as a medium of education? Or are there sociodemographic characteristics that predispose certain individuals to higher or lower rates of participation? The following section explores the possibility that learners’ sociodemographic characteristics can in part explain their differing levels of participation in the CALL computer conference.
Using analysis of variance procedures to compare the mean level of participation by learners with different characteristics, Table 5 provides a basic picture of the importance of different sociodemographic factors for participation in the CALL computer conference.
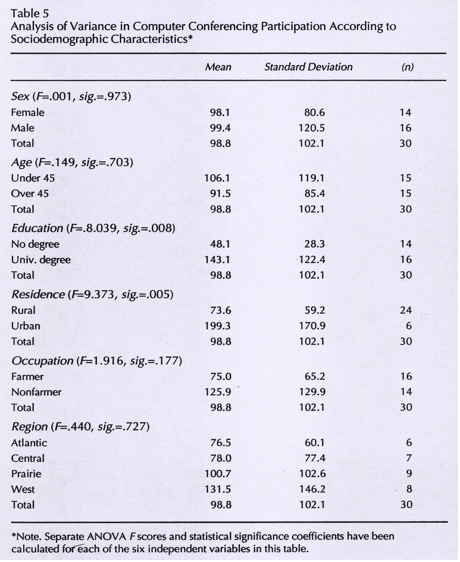
Learners’ average level of participation in this computer conference did not vary according to sex. Men and women had virtually identical mean levels of participation. However, there was a difference, indicated by the standard deviation scores, in the variability of participation of men and women. Men were disproportionately represented at either the high or low end of participation, whereas women were clustered more strongly in the middle. Of the eight low-end users, six were men. Of the seven high-end users, four were men.
Learners’ age did not have a strong relationship to their average level of participation. Learners younger than 45 sent an average of 15 more messages than did those older than 45. Regression analysis also failed to reveal any meaningful relationship between age and level of participation. As with sex, age more strongly predicts variability in learners’ rates of participation than it predicts their level of participation. Learners over the age of 45 were more likely to be at the high or low end of the participation spectrum, whereas those under 45 were more likely to be in the middle.
The relationship of formal education to level of computer conferencing participation was both statistically significant and practically important. Learners with university degrees sent nearly three times the number of messages as did learners without degrees. The low standard deviation score for nondegree holders indicates that not having a university degree was a very strong predictor of relatively low participation in the computer conference. All seven high-end users had university degrees.
Whether a learner lived in an urban or rural area also had a strong and statistically significant relationship to his or her level of participation. The gap between rural and urban dwellers was the largest absolute gap identified in our study. Learners living in cities sent an average of 10 messages per month to the conference, whereas learners outside of cities sent an average of fewer than four messages per month. Of the eight low-end users, only one lived in a city.
Both occupation and region of residence had modest but not statistically significant relationships to participation. Nonfarmers contributed an average of about 50 more messages to the computer conference than did farmers. Residents of Atlantic or Central Canada contributed fewer messages than did residents of the Prairie Provinces (Manitoba and Saskatchewan) or the West (Alberta and British Columbia).
From Table 5 it appears that sex and age had no impact on participation, that occupation and region of residence may have had minor impacts on participation, and that education and residence in rural or urban areas had major impacts. However, these initial appearances may reflect the interrelated character of different socioeconomic characteristics. Do interrelationships between the various sociodemographic variables in our study influence the appearance of relationships between individual variables and learner participation? Table 6 investigates this possibility by documenting average levels of participation while controlling for learners’ level of formal education.
Table 6 affords a more complete understanding of the relationships between sociodemographic characteristics and learners’ participation in the CALL computer conference. When level of formal education is held constant, sex and age still do not appear to have had any impact on learners’ level of participation. Men and women without degrees had virtually identical rates of participation. Among learners with university degrees, men contributed slightly more messages, although the difference had neither practical nor statistical significance. Among learners with university degrees, those under the age of 45 participated slightly more, whereas among those without university degrees, those under the age of 45 participated slightly less.
Table 6 reveals that even under the control condition, both education level and residence in rural or urban areas still make a meaningful difference in the average level of participation. Comparing across every other variable (i.e., sex, age, occupation, residence, and region), learners with university degrees were substantially more active than learners without degrees. As Table 6 documents, the influence of education on participation is statistically significant (at the .05 level) among women, those over 45 years of age, rural residents (all urban residents had university degrees), farmers, and residents of Manitoba and Saskatchewan. Among degree holders, urban residents were still much more active than their rural counterparts, but the difference between the two groups was not statistically significant. Although not reported in Table 6, comparing across the variable of education, we found no statistically significant relationships by sex, age, residence, occupation, or region.
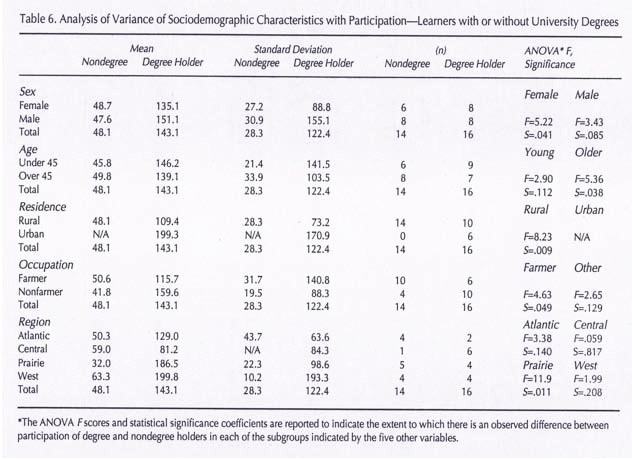
An interesting observation from Table 6 relates to the decreased size relative to Table 5 of the apparent relationships between occupation, region, and level of participation. Among those with degrees, nonfarmers contributed somewhat more messages than did farmers. However, among learners without degrees, farmers actually contributed slightly more messages than did nonfarmers. Thus the apparent modest relationship between occupation and participation reported in Table 5 can be interpreted in part as a reflection of the fact that nonfarmers in this group of learners were more likely than farmers to hold university degrees. Similarly, the east-west gradient of participation reported in Table 5 largely disappears in Table 6. Differences of participation between regions existed among learners with degrees, but were small among learners without degrees.
In Tables 3 and 4 we identified substantial variability between the levels of participation of different learners in the CALL computer conference. In Tables 5 and 6 we identified education and residence in rural or urban areas as the key sociodemographic variables, which might help explain why so much variability of participation existed in the CALL computer conference. What is the relative importance of education and rural or urban residence when explaining the overall variability in learner participation in this computer conference? Are these sociodemographic characteristics actually important in comparison with other factors such as Bullen’s (1998) list of dispositional and situational factors? With such a small number of learners such questions cannot be answered authoritatively. However, despite its limited usefulness with such a small (n=30) and not randomly selected sample, regression analysis provides a rudimentary estimate of the relative strength of education and residence in urban or rural areas as predictors of learners’ participation in the CALL computer conference.
Table 7 presents the basic regression equation for education and residence in urban or rural areas with overall level of participation in the CALL computer conference.
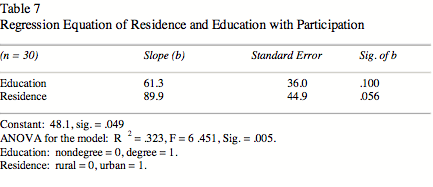
In addition to indicating (by reported “slopes”) the influence of education and residence on participation when holding the other key independent variable constant, Table 7 estimates the strength of these two sociodemographic variables’ relationship to participation. The R2 value of .323 suggests that nearly one third of all variability in levels of participation in the CALL computer conference can be attributed to the influence of education and residence in rural or urban areas. In other words, using this regression equation to predict the level of learners’ participation results in predictions that are 32.3% more accurate than simply using the mean (98.8) for predictive purposes. For example, a rural learner without a university degree would be expected to have sent about 48 messages to the conference, whereas an urban learner with a university degree would be expected to have sent about 199.3 messages. Adding the other four sociodemographic variables in this study to the regression equation does not appreciably strengthen the predictive power of the model. With all six independent variables included in the model, the R2 value only increases to .356, and the statistical significance of the model drops to .09. About two thirds of the variability in learners’ participation in this study cannot be attributed to the sociodemographic variables included in the analysis. This variability can be understood as reflecting situational and dispositional factors, random differences, and other structural variables that are not included in the analysis.
This article explores the influence of six sociodemographic variables on the level of participation in a computer conference: sex, age, education level, residence in urban or rural areas, occupation, and region of residence in Canada. Of these six variables, only education and residence in urban or rural areas were significantly related to rates of participation. Somewhat surprisingly, sex and age were not associated with overall rates of computer conferencing participation. Learners with university degrees participated more than did learners without degrees, and learners residing in cities participated more than did learners residing in rural areas. Intuitively, these findings make sense. Holders of university degrees probably have certain skill sets (typing, computer use, etc.) less common among those without degrees. Learners with university degrees may also have a higher level of interest or motivation for computer conferencing, because such work has parallels with the structures of university study. Our findings with regard to the differences between urban and rural residents may be less valid than our findings with regard to education. Only six learners in our study lived in cities, and selection bias may explain these individuals’ relatively higher rate of participation. The urban learners in this study were all professionals whose daily responsibilities required them to practice the skills required for successful computer conferencing participation. However, there are potential explanations for rural-urban differences in learner participation. Internet connectivity may be slower and more expensive in rural areas. Rural learners may face longer commuting times for work, recreation, and shopping. Such time demands may give rural learners less frequent proximity to their computers and thus reduce their practical level of opportunity to participate.
In this modest empirical study we have provided support for the argument that learners’ computer conferencing participation is related to sociodemographic characteristics. Of all the variability between learners in the CALL computer conference, nearly one third can be attributed to education and residence in urban or rural areas. In practical terms the recognition that educated urban learners may be more likely to participate actively in computer conferencing has important implications for the design and facilitation of such forms of distance education. For example, differential attention may be necessary for the orientation and counseling of learners to ensure successful participation in an online environment. It may be appropriate, given scarce resources for computer conference facilitation, to focus more energy and attention on rural learners and learners with relatively less formal education. This may mean more intensive orientation, training, and support regarding the use of the technology for learning.
Although this study has provided an analysis of participation rates as they relate to certain sociodemographic characteristics of online users in an application of computer conferencing to adult leadership development, further exploration is needed to determine the causal factors linking sociodemographic characteristics with differential participation in online learning environments. How do sociodemographic variables relate to dispositional and situational factors? How do learners with different dispositions and situations respond to different approaches of design and facilitation in an online learning environment? How do learners’ sociodemographic and individual characteristics predispose them to respond differently to various facilitation styles, online learning task designs (e.g., cooperative vs. competitive), the use of team or group projects, and alternative forms of administrative or technical support? Although it is relatively straightforward to show that unequal computer conferencing participation is influenced by both individual and sociodemographic variables, it is a greater challenge to sort out how such variables interact with one another to determine learners’ participation rates. Dealing with this greater challenge is essential for the practical removal of barriers to equitable participation.
We encourage further studies to explore the complex variables affecting participation in online learning environments, and we hope that this article will lead such studies to be sensitive to the role of sociodemographic characteristics in computer conferencing participation. We also encourage further studies of sociodemographic variables that we were unable to include in this analysis, such as ethnicity and social class. Finally, although our study shows no significant relationship between either sex or age with participation, it is entirely possible that such sociodemographic characteristics might be important in other contexts. Indeed, May (1994) and Burge (1998) document substantial qualitative evidence for the position that men and women experience distance learning technologies differently.
Bullen, M. (1998). Participation and critical thinking in online university distance education. Journal of Distance Education, 13(2), 1-32.
Burge, E. (1998). Gender in distance education. In C. Campbell Gibson (Ed.), Distance learners in higher education: Institutional responses for quality outcomes (pp. 25-45). Madison, WI: Atwood.
Davie, L. (1989). Facilitation techniques for the online tutor. In R. Mason & A. Kaye (Eds.), Mindweave: Communication, computers, and distance education (pp. 74-85). Oxford, UK: Pergamon Press.
Davie, L.E., & Wells, R. (1991). Empowering the learner through computer-mediated communication. American Journal of Distance Education, 5(1), 15-23.
Eastmond, D.V. (1995). Alone but together: Adult distance study through computer conferencing. Cresskill, NJ: Hampton Press.
Feenberg, A. (1993). Building a global network: The WBSI experience. In L. Harasim (Ed.), Global networks: Computers and international communication (pp. 185-197). Cambridge, MA: MIT Press.
Garrison, D.R. (1997). Computer conferencing: The post-industrial age of distance education. Open Learning, 12(2), 3-11.
Harasim, L.M. (1987). Teaching and learning on-line: Issues in computer-mediated graduate courses. Canadian Journal of Educational Communication, 16(2), 117-135.
Harasim, L.M. (1990). Online education: An environment for collaboration and intellectual amplification. In L.M. Harasim (Ed.), Online education: Perspectives on a new environment (pp. 39-64). New York: Praeger
Harasim, L.M. (1995). Teaching by computer conferencing. In L.M. Harasim (Ed.), CMC design and facilitation (pp. 15-23). Madison, WI: Distance Education Professional Development Program, Department of Continuing and Vocational Education, University of Wisconsin-Madison.
Harasim, L.M., Hiltz, S.R., Teles, L., & Turoff, M. (1997). Learning networks: A field guide to teaching and learning online. Cambridge, MA: MIT Press.
Kanuka, H., & Anderson, T. (1998). Online social interchange, discord, and knowledge construction. Journal of Distance Education, 13(1), 57-74.
Kouzes, J., & Posner, B. (1995). The leadership challenge (2nd ed.). San Francisco, CA: Jossey Bass.
May, S. (1994). Women’s experiences as distance learners: Access and technology. Journal of Distance Education, 9(1), 81-98.
Mercer, A. (1994). Introducing mass e-mail for extramural courses: A “how-to” guide. Palmerston North, NZ: Massey University, Centre for University Extramural Studies.
Palloff, R.M., & Pratt, K. (1999). Building learning communities in cyberspace: Effective strategies for the online classroom. San Francisco, CA: Jossey-Bass.
Paulsen, M.F. (1996). The online report on pedagogical techniques for computer-mediated communication [Online]. Available: http://www.nki.no/~morten/
Ross, J.A., Crane, C.A., & Robertson, D. (1995). Equity of access to computer-mediated distance education. Journal of Distance Education, 10(2), 17-32.
Scott McLean is an associate professor in the University of Saskatchewan Extension Division. He holds a doctorate in sociology from Carleton University. His e-mail address is scott.mclean@usask.ca.
Dirk Morrison is an instructional designer in the University of Saskatchewan Extension Divison. He is a doctoral canadiate in the Ontario Institute for Studies in Education, University of Toronto. His e-mail address is dirk.morrison@usask.ca.