VOL. 26, No. 1
In an attempt to foster student integration in virtual education programs, several higher education institutions have launched systematic large-scale hand-outs of personal computers, inspired by the “One Laptop per Child” distribution model. However, the level of impact of these initiatives on academic performance is not yet well understood. This article aims to explore student responses to changing levels of access to IT hardware, applying multiple correspondence analysis. Some of the broader socio-economic factors affecting education are also examined.
Dans le but de favoriser l'intégration des étudiants aux programmes d'enseignement virtuel, quelques établissements d'enseignement supérieur ont distribuées des grandes quantités d'ordinateurs personnels à ses étudiants, suivant le modèle de distribution du projet "One Laptop per Child". Cependant, les effets de ces initiatives sur le rendement scolaire ne sont pas encore bien compris. Cet article vise à evaluer le rendement des étudiants vis-à-vis ses differents niveaux d'accès aux ordinateurs, en appliquant l'analyse des correspondances multiples. Des facteurs socio-économiques qui influent sur l'éducation seront aussi explorés.
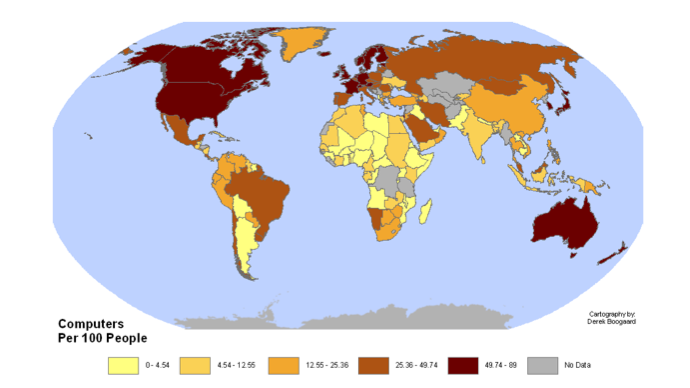
In November 2007, the One Laptop per Child Association (OLPC), a non-profit organization created at the Massachusetts Institute of Technology Media Lab, began the production of the CM1 computer – the first working prototype of an affordable, crank-powered, Linux-based laptop especially designed for the use of children six to twelve years old in developing countries. The OLPC project was founded on the belief that unequal access to digital resources will become one of the principal causes of social exclusion in the Twenty-First Century (cf. Madon 2000). As computer and Internet use grew exponentially among North American and Western European families throughout the 1990s, vast regions of the world were left behind. According to Chinn and Fairlie (2004), in 2001 there were 61 computers per hundred people in North America, but only 0.5 per 100 in South Asia. In response to this imbalance, the OLPC project took on as its mission “to create educational opportunities for the world’s poorest children by providing each child with a rugged, low-cost, low-power, connected laptop with content and software designed for collaborative, joyful, self-empowered learning”.
OLPC’s underlying premise is that the large-scale distribution of Information and Communication Technology (ICT) among the less privileged will enable us to tackle problems of accessibility to computers and simultaneously improve IT literacy rates. OLPC thus links access with use and practice, relying on models of self directed learning and top-to-bottom approaches to education. Nicholas Negroponte, founder of the OLPC project, has summed up this association between access and use with the phrase “you can give kids XO laptops and just walk away” (Vota 2010). The availability of ICT resources and the development of ICT skills, in turn, are expected to have a positive impact on interrelated socio-economic factors, reducing multiple forms of deprivation such as poverty, social exclusion and illiteracy, not just among the children but also within their broader community. The OLPC initiative has been welcomed by several non-governmental organizations and educational institutions (such as UNICEF, the NEPAD, and the University of South Pacific) as a step forward in the fight against global inequality and an efficient means of increasing public awareness of the problems associated with the digital divide.
Fig. 1: The global digital divide. Number of computers per 100 people
according to data from the 2006 United Nations Global Development Goals Indicators.
Bharat Mehra defines “digital divide” simply as “the troubling gap between those who use computers and the Internet and those who do not” (2004: 782). The term originated in the United States between 1995 and 1997 (Irving et al. 2000), when it was allegedly adopted by the Clinton administration and a group of journalists to describe the growing social inequalities in the level of access to technology. Speaking of a mobile computer lab in a truck, Al Gore said, “It’s rolling into communities, connecting schools in our poorest neighborhoods and paving over the digital divide”.
Today, the words “digital divide” tend to be accompanied in the media by images of remote settlements in non-industrialized nations. We are often reminded that the unequal spread of ICT in India deepens the gap between the Haves and the Have-Nots, that the deployment of telecommunications infrastructure across the African continent poses significant logistical difficulties and that people in the more remote areas of Latin America must queue up for a long time in order to access an Internet connection. However, the challenges raised by the digital divide are far from exclusive to developing regions. Like many other social and economic problems, the digital divide is a global issue. In Canada, approximately 35% of the population outside urban areas has no access to the Internet, with First Nation communities particularly affected by poor levels of digital integration (IPSOS Reid 2007; Bredin 2001). According to a study by OFCOM (the independent regulator and competition authority for the UK communications industry) broadband use in the UK is steadily increasing (at an average three per cent each year) but a breakdown of the data per region indicates that there still are parts of the country with relatively little access to adequate digital resources. For example, in 2010, nearly 40% of homes in the West Midlands had no form of Internet connection, closely followed by Scotland with over 35% of homes unconnected (OFCOM 2010). Similar levels of inequality are observable across continental Europe, with Internet penetration rates as high as 90% in Sweden and as low as 44.40% in Greece (ITU 2011).
This situation has prompted a number of official initiatives. In 2005, the United Nations launched the WSIS project, a fundraising campaign aiming to bridge the digital divide and make ICTs accessible to all by 2015. In the United States, the Obama administration has pledged an initial $7.2-billion (U.S.) to an ambitious broadband plan that calls for 100 million Americans to have access to super high-speed connectivity. In the UK, plans have been launched to establish a nation-wide network of 6,000 ICT learning centers in schools and libraries (£300 million have already been invested in laptops and broadband for low income households) and the Mid West Regional Authority has launched the CitizenFirst project (aimed at making e-services more widely accessible and socially inclusive).
However, progress is not as fast as expected. In 2000, the British central government pledged to achieve universal access to the Internet by 2005 in the UK. Seven years after the deadline, this remains a distant goal. In Canada, approximately four out of every ten citizens over the age of 55 remain without adequate access to the Internet (Ipsos Reid 2007). In the USA, Hispanic and black communities still have lower levels of access to ICT than their white counterparts (Debell and Chapman 2006; Rainie 2010). When the first signs of large-scale IT-related inequalities became apparent during the mid 1990s, international investors dismissed the problem as merely a passing phase – a problem which “universal access” to mass-appeal technologies, such as digital TV, would soon remedy. Today it is increasingly clear that the bridging of the digital divide will pose a more persistent challenge than this.
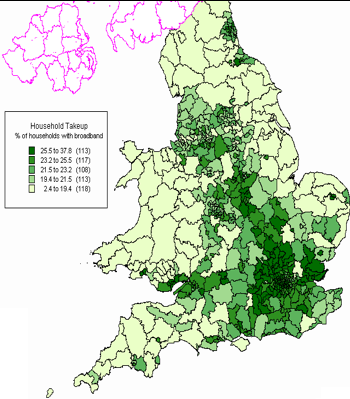
Figure 2: The digital divide in England and Wales. Levels of access to broadband in May 2005
(after Point Topic Broadband Neighbourhood).
The use of ICT in education has increased dramatically in the last decade. The benefits of digital technologies are particularly appealing to large-scale higher education institutions – they offer a gateway to vast amounts of content and resources for staff and students, they provide an efficient infrastructure for asynchronous interaction, e.g., via e-mail exchanges (thus allowing for flexibility in time-tables) and can also be used as a relatively affordable means of establishing real-time communication between individuals who are located in different parts of the world (thus providing the potential to substantially increase the student body through the implementation of online-based study programs). In addition, embedding ICT across a variety of modules encourages students to become more familiar with the use of computers and the Internet, which is widely regarded as a valuable transferable skill.
Attracted by these advantages, a growing number of higher education institutions are currently focusing on increasing the use of course websites, electronic submission of assignments and online quizzes with instant feedback as part of their regular courses. In addition, e-learning programs (i.e., courses that are taught wholly in Virtual Learning Environments – VLEs) have been introduced as a viable educational and financial strategy (particularly for Arts courses such as archaeology, classics and history). Out of 29 modules currently offered by the Open University (UK) in classics, history and archaeology, for instance, nine (31 per cent) are described as being “taught exclusively by means of electronic tuition and online forums”.
Despite the advantages associated with VLEs, the rapid increase in the use of ICTs in education has raised some concerns. As more interactive course content, administrative features and formative assessments become available online and students engage more with others through forums and blogs, there is a perceived risk that the disadvantaged will become increasingly so if they do not have regular access to adequate ICT resources. In the Associate Lecturer Survey of 2007 (http://tinyurl.com/32cbta) conducted by the Open University among all its tutors, a majority (69 per cent) expressed concern about the fact that the University’s increasing emphasis on e-learning programs risks excluding “the very people the University was designed for”.
According to Anne Pike (2007), the severity of the problem posed by the digital divide in higher education is particularly evident at penal offenders institutions. Open University modules are classed as “green”, “amber” or “red” depending on the perceived risk involved in allowing prisoners to study them. Frequently, “red” (i.e., banned) modules are given that rating because they featured on-line discussion activities in which prison students are not allowed to take part. The proportion of “red” modules is increasing at the expense of “amber” and “green” ones. This problem is so acute that, according to Pike, there is a real danger that there might not be access to distance-based higher education in prisons in the near future.
Problems of access to ICT also pose challenges to students in residential care, hospitals (cf. Hancock 2008) and, indeed, many day-to-day domestic environments. Some education centers have reacted to these challenges by investing heavily in ICT hardware. For instance, in 2008, the University of Seville (Spain) decided to provide each new student with a laptop, acting on the principle that a technology-enabled teaching and learning environment (and adequate access to the ICT resources that make it possible) are central to a modern education. Affordable IT solutions (such as value-range laptops) have become more widely available in recent years. However, for higher education departments with limited budgets and large student numbers, the expenditure associated with providing each student with a personal computer is far from insignificant. It is particularly important for these departments to ascertain whether investing in the principle of “one laptop per student” is a real necessity, and whether this would provide true value for money in terms of academic performance. This is a concern particularly for Arts programs, such as archaeology, history and classics, which are often faced with low budgets compared to their science counterparts – see, for instance, the HEFCE 2011-12 Data for Quality-Related Research report (http://tinyurl.com/3m3csaj).
As educational institutions reformulate their policies and infrastructures in response to new ICTs, it becomes crucial to understand the relations between adequate access to the technology and the academic performance of students. In addition, questions of access to ICT in educational environments are significant because of their association with a broader set of vulnerabilities affecting student populations. These vulnerabilities can be linked to complex socio-economic and pedagogical factors, therefore requiring solutions that go well beyond the mere adoption of new distribution channels for computer hardware. This paper will explore how indices of multiple deprivation and vulnerability criteria schemes (i.e., general methodologies aiming to identify the individuals who are most at risk of being left behind) could be adapted by higher education institutions in order to better understand the underlying reasons for poor levels of digital integration and react to the different risk areas in a more efficient and targeted manner.
The remainder of this paper will attempt to shed some light on these questions by focusing on a case study from the World Archaeology (A251) module (2008-2009 presentation), which was launched in August 2007 by the Open University (UK). The Open University is a distance-based higher education institution that was created in Britain to promote educational opportunity and social justice. Since it opened its doors to students in 1971, it has pioneered teaching and learning methods that enable people to achieve their career and life goals by studying at times and in places to suit them. More than 250,000 students are currently enrolled at the Open University, with some modules having as many as 4,000 students per presentation.
As with other new modules, the Open University’s regional centers, associate lecturers and course designers were in close contact during the first year of A251, assessing whether this module’s goals were being fulfilled and identifying areas of challenge for the students. The information obtained thus far from reports and feedback forms strongly suggests that one of the key factors in the module’s capacity to meet its aims in the future would be the students’ response to the new learning environment – a virtual setting. World Archaeology is taught exclusively over the Internet; interaction between students and tutors takes place in on-line forums with no face-to-face meetings.
In a higher education institution like the Open University, ICT offers great opportunities to help manage the large numbers of students enrolled in some of the modules. However, ensuring the provision of personalized support, avoiding alienation and ensuring digital integration become potential areas of concern. The study described here aims to determine whether there is a statistical correlation between the academic performance of the students enrolled in the A251 World Archaeology module (2008-2009 presentation) and their levels of access to ICT resources. The broader aim is to set these results in the wider context of e-learning environments in order to shed light on whether programs conducted in virtual settings could have the adverse effect of further alienating those who already have limited access to IT skills and resources, and, if so, whether investing in the principle of “one laptop per student” could provide a viable solution (financially and academically) for higher education institutions.
Research into good practice in e-learning programs is still a relatively young field. In the last few years, Education Studies and other associated disciplines have begun to assess the challenges and opportunities linked with aspects such as software licensing, interface designs, IT literacy rates, the efficient integration of different VLE platforms and potential barriers for disabled students in operative systems (cf. Dhanarajan 2001; HEFCE 2004; Sancho et al. 2002). However, relatively little research has been conducted into the hardware and physical-reality needs arising from virtual learning – particularly with regard to the challenges posed by providing students with physical access to computers and Internet connections. It would appear that, at this incipient stage, consumer trends and market pressures (rather than academic research) are influencing the ICT investment strategies currently implemented by many higher education institutions. However, general patterns of consumption are not necessarily efficient indicators of suitability for modes of implementation of new infrastructure in educational environments. We would therefore profit from an increase in the systematic and objective assessments of the IT hardware distribution methods that are better suited for the optimization of ICT accessibility levels among student populations.
The emphasis in this experiment is placed specifically on students’ academic performance in relation to different levels of access to IT hardware. A range of levels is explored – from no access at all to an adequate level of access. “Adequate level of access” to IT hardware is understood here as the availability of ICT material that will allow the student to realize his/her full academic potential and which the student can expect to be able to use on a regular basis with no limitations in his/her study space throughout the duration of the module.
In order to explore these relations between access to ICT equipment and academic performance, a statistical analytical technique known as correspondence analysis has been applied. Correspondence analysis is a method of factoring variables (i.e., a way of breaking them down in search of similarities) and visually mapping their degree of association. The technique, which was developed in the 1970s (Lebart et al. 1984; Schiltz 1990), is based on an implementation of quasi-log linear analysis (a modern successor of the chi-squared test). The starting point for a correspondence analysis is a contingency table. In this table, the rows contain the cases (the students included in the analysis) and the columns contain their categorical variables (the characteristics or conditions associated with the students). The aim of the correspondence analysis is to perform a cross-tabulation to explore the associations between the values of different categorical variables and their respective cases.
In this project, multiple correspondence analysis has been used. Unlike two-way correspondence analysis (which explores how one set of variables is affected by variations in another set in simple two-way cross-classifications), multiple correspondence analysis allows us to simultaneously test the interrelations between many different factors (i.e., to explore n-way or multi-way tables). This is particularly well suited to the analysis of multi-factorial scenarios (such as the exploration of potential factors in a student’s academic performance).
The results of a correspondence analysis are represented visually in the form of a biplot. Biplots are statistical graphs that represent in the same plane both the categorical variables and their cases. The graphs are subdivided by two axes, thus, creating four sectors. The point at which the axes intersect (represented on the biplot as X: 0, Y: 0) is referred to as the origin. The origin of the biplot is the equivalent of the expectation (the total average, or the aspects from all the variables which are most common to the sample as a whole). Each of the categorical variables is represented on the biplot as a point.
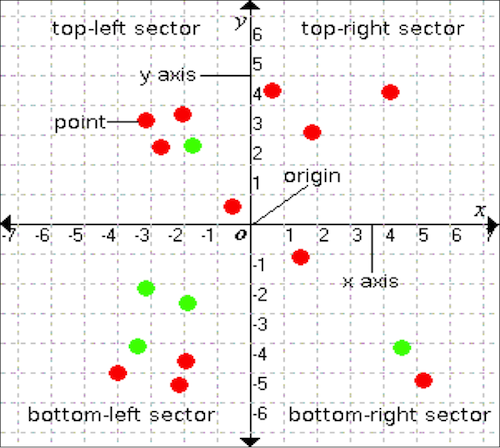
Figure 3: Structure of a two-dimensional correspondence analysis biplot.
The position of a point on the biplot is indicative of its departure from the expectation. The further away from the origin (0, 0), the further the point is distanced from the expectation with regard to the whole sample. This measure of difference is known as residuality. Residuality can be measured in a biplot using the scaled principal components for the cases and the scaled principal axes for the variables, which are the numbers printed along the two axes. Rescaling is given by the eigenvalues, which can be thought of as scores for the levels of correlation between row and column.
In order to treat the relative positioning of the points with respect to each other on the graph as a measure of their degree of association (i.e. of their correlation), standardization must be applied. Standardization converts values into z-scores (i.e. the difference between the obtained score and the mean, divided by the standard deviation), thus allowing us to compare a set of values for different variables on a fixed scale (Fletcher and Lock 1991: 47). If two or more points from different categorical variables are close to each other (i.e. clustered), the values display a stronger statistical relation compared to points that are further away, which means that they tend to appear together in the observations. Crucially, each of the sectors of the biplot (subdivided by the two axes) are opposed to each other (like a mirror’s reflection, insofar as the image is reversed). Therefore, two points plotted on different sectors of the same graph should generally be regarded as being negatively correlated (i.e. anti-correlated), unlike two points plotted in the same sector (which display a degree of correlation). The further away from the axis dividing each of the two sectors, the stronger the opposition between the two points.
It is important to remember that the biplot itself is only part of the story. In order to represent relations between variables in such a way that patterns are visible, the data matrix must be factored (i.e. the data set is reduced, which results in some data being lost). The biplot can be conceived as a slice through a complex and multi-dimensional space. One of the most efficient ways of assessing the reliability of a biplot (in terms of its representativity in relation to the original data set) is through the cumulative percentage value. Cumulative percentage is calculated by dividing the cumulative frequency by the number of observations, then multiplying by 100.
The analysis conducted here is based on a sample of 60 students (out of a total of 900 enrolled in the 2008-2009 presentation). Each presentation of the module lasts five months, starting in September and finishing in January. Reference numbers in the database have been substituted for the students’ names in order to provide anonymity. For the purposes of the study, these students were subdivided into six groups:
(All participating students were requested to provide notification of any changes in their levels of access to ICT equipment throughout the duration of the experiment.)
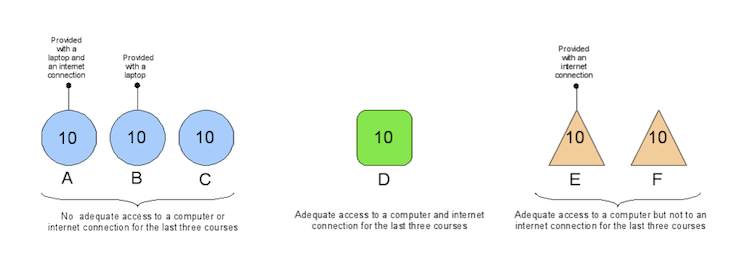
Figure 4: Division of the students into six groups during the experiment.
Once the module started, students in group A were provided with a laptop and an Internet connection, students in group B were provided with a laptop, and students in group E were provided with an Internet connection. This structure is intended to allow the diachronic exploration of the students’ academic progress in response to different levels of access to ICT (by comparing individual levels of performance to those of fellow students in the experiment as well as to the individual students’ own performance in previous modules).
The students’ academic performance was assessed using five criteria:
Demographic factors have also been taken into account in the experiment, based on criteria adopted as indicators of socio-economic conditions by the National Telecommunications and Information Administration with the USA Census Bureau (1999), Chinn and Fairlie (2004) and the UK National Statistics Annual Population Survey. In particular, a multiple-choice questionnaire circulated prior to the start of the module requested students to provide information about:
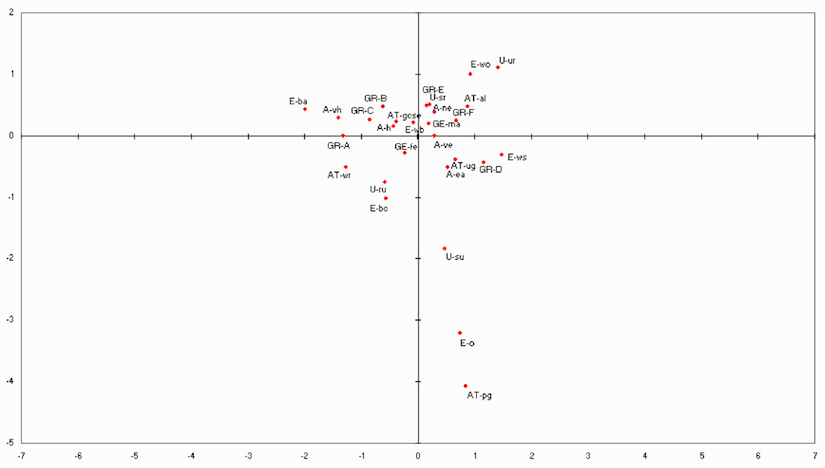
Firstly, the relation between the students’ initial levels of access to ICT hardware and several demographic variables was explored. The biplot in Fig. 5 represents the associations between the student groups in the experiment (each with a different level of access to computers and Internet connections) and the factors “ethnic background”, “gender”, “academic tradition”, “perceived affordability of ICT hardware” and “degree of urbanization in the living environment”. The graph reveals that there is indeed a clear correlation between socio-economic factors and the levels of access to ICT available to the students during their last three modules at the Open University. Groups A, B and C (i.e., students who have had no access to a computer or Internet connection for the last three modules) cluster in the two left sectors of the biplot. The position of GR-A on the very border between the top-left and bottom-left sectors of the graph suggests that the students in this group are associated with the variables plotted on both sectors. Groups E and F (students who have had access to a computer but not an Internet connection) cluster in the top-right sector. Group D (students who have had access to a computer as well as an Internet connection) is located on its own in the bottom-right sector of the biplot.
GR |
Group (as described in Fig. 4) |
A |
Student's perceived affordability of IT hardware (vh = very hard to afford, h = hard, ne = neither easy or hard, e = easy, ve = very easy) |
GE |
Student's gender (fe = female, ma = male) |
AT |
Academic tradition in the student's immediate family, represented here as the highest level/qualification (wr = basic writing skills, gcse = GCSE or equivalent, al = A Levels or equivalent, ug = undergraduate degree, pg = post-graduate degree) |
E |
Ethnic background (ba = black African, bc = black Caribbean, wb = white British, ws = white Scottish, wo = white other, o = other) |
U |
Degree of urbanization in the student's living environment (ru = rural, sr = semi-rural, suy = suburban, ur = urban) |
Figure 5: Correspondence analysis biplot including the variables: group, perceived affordability of ICT hardware, gender, academic tradition in the student’s immediate family, ethnic background and degree of urbanization in the student’s living environment.
The two left sectors (those associated with groups A, B and C) are characterized by lower levels of academic tradition among the students’ immediate family members, with basic writing skills and GCSEs (or equivalent) as the more common highest level/qualification. Groups E and F, on the other hand, are more closely associated with A Levels. The highest academic qualifications of the students’ family members from the entire sample are linked to group D (which is most strongly associated with undergraduate degrees). A case of post-graduate degree is also located in the bottom-right sector of the graph (linked with group D). However, the relative rarity of this qualification within the sample is clearly reflected by the point’s position, which is very distanced from the graph’s origin and separated from the main clusters in the biplot.
Table 1. General association trends between the experiment’s six test groups and the factor “academic tradition in the immediate family” in the biplot of Fig. 5.
Basic writing skills |
GCSE or equivalent |
A Levels or equivalent |
Undergraduate degree |
Post-graduate degree |
Group A |
Groups B and C |
Groups E and F |
Group D |
Group D |
From a financial point of view, it is apparent that students in groups A, B and C are more likely to perceive ICT hardware as hard or very hard to afford. By contrast, students in group D tend to perceive ICT hardware as easy or very easy to afford. Students in groups E and F are more closely associated with the view that ICT hardware is neither easy nor hard to afford.
Table 2. General association trends between the experiment’s six test groups and the factor “perceived affordability of IT hardware” in the biplot of Fig. 5.
| Very hard to afford | Hard to afford |
Neither easy or hard to afford |
Easy to afford | Very easy to afford |
Groups A, B and C |
Groups A, B and C |
Groups E and F |
Group D |
Group D |
With regard to ethnic identity, the biplot shows that, unsurprisingly, students who described themselves as “white British” are by far the most ubiquitous in the sample (as reflected by the point’s position, very close to the graph’s origin). Interestingly, students who described themselves as “black African” and “black Caribbean” are strongly associated with the left two sectors of the graph (groups A, B and C), whilst students who described themselves as “white other” are more closely associated with the two right sectors of the biplot (groups D, E and F). This scatter strongly suggests that there is a correlation between access to ICT hardware and ethnic affiliation, with ethnic minorities generally affected by poorer levels of access.
Table 3. Relative position of the experiment’s participants on the biplot of fig. 5, arranged by ethnic identity. The left sectors of the biplot generally show a predominance of students with lower levels of access to ICT hardware in the last three modules taken at the Open University, lower academic level/qualifications in the immediate family and higher levels of perceived difficulty in affording the purchase of ICT hardware. The middle area of the biplot represents the origin (i.e., the average). The right sectors of the biplot generally show a predominance of students with higher levels of access to ICT hardware in the last three modules taken at the Open University, higher academic level/qualifications in the immediate family and perceived ease of affordability in the purchase of ICT hardware).
Left sectors of the biplot |
Middle (biplot's origin) |
Right sectors of the biplot |
Black Caribbean, Black African |
White British |
White Scottish, White other, Other |
The degree of urbanization in the students’ living environment also acts as a significant factor with regard to the students’ levels of access to ICT hardware. Rural environments are more closely associated with students who have had no access to a computer or Internet connection for the last three modules (i.e. groups A, B and C), whilst students in groups D, E and F are more closely associated with urban, sub-urban and semi-rural environments. With regard to gender, males and females are plotted on two different sectors of the graph. However, both points are within such close distance to the origin of the biplot that it is difficult to determine with any degree of certainty whether this variable is indeed a significant factor in the students’ levels of access to ICT hardware on the basis of this graph alone. The biplot in fig. 6 allows us to shed some more light on the issue – males and females are, once again, plotted very close to the graph’s origin. However, on this occasion the positions are reversed: females are located on the half of the biplot that is linked with students who exhibit a higher academic performance and who have generally better levels of access to ICT hardware, whilst males are located on the half of the biplot that is characterized by a low/average academic performance and poorer levels of access to ICT hardware. This combined pattern suggests that gender is not a truly significant factor in the relation between the students’ academic performance and their levels of access to ICT equipment in this experiment’s sample.
GR |
Group (as described in Fig. 4) |
M |
Mark received by the student for the course in the 2008-2009 presentation |
IM |
Student's level of improvement (or lack thereof) relative to his/her average mark for his/her last three courses undertaken at the Open University |
EX |
Number of extensions (if any) requested by the student for the submission of assignments (out of a total of four) in the 2008-2009 preentation |
AP |
Student's amount of participation in online tutorials during the 2008-2009 presentation (measured as a total word count) |
FP |
Student's frequency of participation in oline tutorials in the 2008-2009 presentation (measure as his/her total number of individual posts) |
GE |
Student's gender (fe = female, ma = male) |
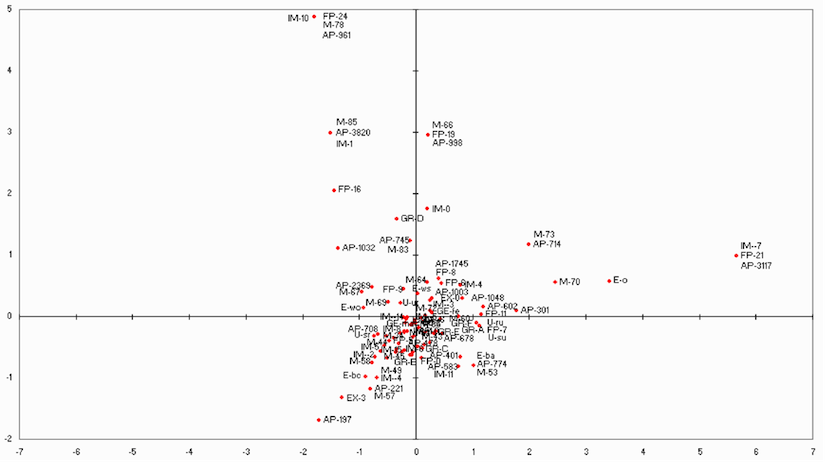
Figure 6. Correspondence analysis biplot including the variables: group, mark received for the 2008-2009 presentation, level of improvement, number of extensions (if any) requested during the module, amount of participation in forums, frequency of participation in forums, gender and ethnic background.
With regard to the students’ responses to changes in their levels of access to ICT, the results obtained in the experiment were revealing. The biplot in fig. 6 explores the progress in the academic performance of each of the groups in relation to the students’ ethnic background and gender. The indicators of academic performance plotted in the graph are: “mark received for the 2008-2009 presentation”, “level of improvement relative to the last three modules”, “frequency of participation in forums” and “amount of participation in forums”.
Once again, there is a clear divide of the biplot into two halves. The top two sectors of the graph are characterized by the presence of indicators of good academic performance: relatively high marks (60s, 70s and 80s), very low levels of requested extensions (with a strong presence of 0), a relatively high frequency of participation in forums and some of the highest total word counts in the forum posts (e.g., 1003, 1048, 1032, 2369). On the other hand, there are no significant signs of improvement relative to the students’ average marks for the last three modules; in fact, the levels of improvement most closely associated with the main cluster of points across the top two sectors of the graph are 0 and +1. (There is also an improvement level of 10 in the top-left sector of the graph and one of -7 in the top-right sector; however, the position of these points is very distanced from the biplot’s origin and clearly separated from the main cluster, which is indicative of a relatively weak association.) This relative lack of improvement in the top two sectors of the graph can be explained by the fact that the only group that is clearly associated with these sectors of the biplot is D (i.e., students who have had adequate access to both a computer and Internet connection for the last three modules at the Open University and whose levels of access to ICT were not altered during the experiment).
The bottom two sectors of the graph, on the other hand, are dominated by a very large and dense cluster of points concentrated around the biplot’s origin and the border between the bottom-left and bottom-right sectors. The academic performance of the students in these two sectors tends to be low/average: the total word count of the forum posts by the students here ranges between 0 and 774, the frequency of participation in the forums is often under 10 and the marks most frequently achieved for the 2008-2009 presentation are 40s and, particularly, 50s.
Table 4. General trends displayed in the biplot of Fig. 6.
Top two sectors |
Lower two sectors |
|
|
An examination of the relations between these indicators of academic performance and the division of students into groups reveals that, contrary to expectation, groups A, B, C, E and F are all plotted in an erratic scatter across the bottom two sectors of the graph. This strongly suggests that there is no significant statistical correlation between modifications in the students’ levels of access to ICT and the academic performance achieved during the 2008-2009 presentation. For instance, group E (students who have had access to a computer for the last three modules but not to an Internet connection and who were provided with an Internet connection) is closely associated in terms of academic performance with group F (students who have had access to a computer for the last three modules but not an Internet connection and whose level of access to ICT remained unmodified). In turn, these two groups are closely associated with A (students who have had no access to a computer or Internet connection for the last three modules and who were provided with both during the experiment), and, together, they share the bottom-right sector with group C (students who have had no access to a computer or Internet connection for the last three modules and whose level of access to ICT remained unmodified). Group B (students who have had no access to a computer or Internet connection for the last three modules and who were provided with a computer) is also plotted relatively close, on the bottom-left sector of the graph.
It is worth noting that these five groups (A, B, C, E and F) are consistently plotted close to the graph’s origin and the sector divides, which is a strong indication of the points’ lack of distinctiveness as categorical variables in the analysis. This lack of distinctive short-term reaction to changes in the levels of access to ICT hardware is also corroborated by the levels of improvement shown by the students. Unlike the top half of the biplot, levels of improvement vary widely in the bottom two sectors, ranging from -14 to +11. Crucially, these different levels are, once again, plotted as an erratic scatter: no single group in the bottom half of the graph is consistently associated with any significant degree of improvement (or lack thereof) relative to each other.
The results obtained in this study strongly suggest that providing a random sample of students with laptops and an Internet connection has led to no consistent improvement in their academic performance within the duration of the experiment (i.e., the 2008-2009 presentation). On the other hand, it is also clear from the results that, despite the fact that students who were provided with adequate access to ICT displayed little change in their academic performance within the five months since the start of the module, those students who had had adequate long-term access to ICT (group D) consistently performed better (in terms of final marks achieved for the module, frequency of participation in the forums, amount of participation and number of extensions requested).
These trends lead us to the conclusion that habituation to ICTs and their use in the development of efficient study skills in VLEs should be regarded as a long-term process. Physical access to ICT hardware is indeed an important element in this long-term development of efficient study skills in VLEs; however, investing in a blanket policy of “one laptop per student” seems to be unlikely to solve, by itself, the problem of the digital divide in education. Although there is a statistical correlation between access to ICT hardware and academic performance, it appears that physical access to ICT equipment is not the exclusive – or even the principal – reason for disparity in the academic performance of students participating in VLEs. Instead, it is part of a broader problem involving different forms of socio-economic inequalities.
The results of this experiment reflect the fact that that there still is a considerable digital divide in the United Kingdom. This problem is clearly not unique to the UK; it is a challenge faced by most regions of the world, in developing as well as industrialized nations. Therefore, there is a real danger that course content available through only VLEs (especially resource-intensive content, such as streaming videos, large files, VoIP communication, or webcam conferences) could alienate a significant sector of the student body. What is more, due to the fast adoption of ICTs in schools and universities, this problem applies not just to distance education and VLEs – it is a difficulty faced by most education centers, which increasingly rely on technology-enabled learning to deliver teaching materials to their students.
The reasons for poor levels of access to ICT hardware are varied and call for different responses (from a financial as well as a pedagogical point of view). As illustrated by Keniston and Kumar (2003), there are several forms of digital divide, each stemming from different sets of circumstances. At the end of this project participating students were contacted to discuss their experience of online learning and their views on the experiment. In the course of the conversations it became apparent that many of the students in groups E and F had had no adequate access to an Internet connection for the last three modules at the Open University because they believed that they lacked the skills to adequately set up the hardware and use the software, not because they found it difficult to afford the payments. Therefore, a drive-by solution (simply posting them a low-cost laptop and walking away) would have had a limited impact on these students’ capacity to integrate into VLE-based modules and would have represented a relatively poor use of financial resources. This contrasted with the general experiences of the students in groups A, B and C, many of whom affirmed that they regarded the purchase of a computer and a subscription to the Internet as a significant investment (as reflected by the clear associations of these three groups with the variables A-vh and A-h in the biplot of fig. 5, contrary to groups E and F, who were more strongly associated with the variable A-ne).
When tackling the problem of the digital divide in higher education, the more successful strategies are likely to be based on a multi-stage process identifying which sectors of the student body are more vulnerable to poor levels of access to ICT, exploring the reasons why and adopting solutions that are specifically geared towards each scenario (e.g., providing access to bursaries, offering IT training at the right level, or combating apathy and feelings of alienation by implementing policies of social inclusion), rather than investing on a single blanket policy of one laptop per student. This, however, poses a challenge to higher education institutions (especially those based on large student populations, like the Open University) – how to reach out to all the students, gather representative data, analyze the information and categorize / prioritize the institution’s responses in a timely and financially viable manner?
One way of approaching this problem is to implement an adaptation of the Indices of Multiple Deprivation. This system, which is used by local governments across England (with many equivalents in use across the world, such as Canada’s Social Risk Index [Favaro and Durocher 2008 ] or Australia’s HILDA system [Melbourne Institute 2010]), combines a number of indicators (based on a range of economic, social and housing factors) in order to generate relative socio-economic deprivation scores for small areas. The aim of the scheme is to identify sectors of society that would benefit from special initiatives or programs and determine eligibility for specific funding streams. By examining various indicators simultaneously and associating them with population profiles, the Indices of Multiple Deprivation provide a quick and efficient manner of identifying complex, multifactorial trends in social deprivation across time and space. Although the data sets are massive, the structure makes it relatively simple to break the sample down into significant subsets, which prepares the ground for a second stage of qualitative analyses and the planning and prioritization of the local governments’ responses.
The Open University already implements a similar system, the Vulnerability Criteria Scheme, with a comparable methodology to the Indices of Multiple Deprivation but a different set of aims. The system was developed as a pilot project for the first-year module AA100 (The Arts Past and Present), which has a particularly large number of students (approximately 4,000 per presentation). The aim of the Vulnerability Criteria Scheme is to respond to the challenge of harnessing useful data available to the front line of student-teacher contact at the university and using this information to predict, prioritize and organize levels of response to students’ educational requirements.
A set of indicators are used to highlight students who may need extra support in two different stages. Before the start of the module, the following factors are examined: postcode (as a proxy for the general socio-economic level of the student’s immediate community), student’s current level of education, new/old student, employment status, late registration and any special requirements (e.g., disability). Halfway through the module, a set of criteria based on the student’s academic performance is examined: extensions requested, levels of participation in online forum, attendance in face-to-face meetings and grades received. Each criterion is given a risk score, which allows the university to categorize large student populations into more manageable subgroups and act rapidly on high-risk cases. As soon as the statistical stage of the analysis has concluded, a qualitative phase is conducted in order to discuss the data with individual students and identify false positives generated by the system. This normally involves a telephone call shortly after the student’s registration and arrangements for additional tutor-student interaction during the module, if required.
The indicators used by the Vulnerability Criteria Scheme can be adapted to different modules, student bodies and educational environments. This existing structure is therefore an ideal platform to incorporate indicators that could help assess which sectors of the student body are more at risk of inadequate levels of access to ICT hardware and why. In this experiment, the student’s perceived affordability of the hardware, academic tradition in the immediate family, ethnic background and degree of urbanization in the living environment have been identified as significant criteria. Gender, on the other hand, does not appear to be an influential factor in this respect.
Although we are becoming rapidly aware of the opportunities and challenges of VLEs, the logistical difficulties of providing large student bodies with adequate physical access to ICT hardware is still an area of online education that would benefit from further investigation. Uncritical blanket policies in the provision of ICT hardware, motivated by market pressures and promises of quick-fix solutions, are unlikely to solve the digital divide problem in education. In contrast, by selectively investing in physical access to ICT equipment and approaching digital integration as a long-term strategy, higher education institutions will help to bridge, not only the digital divide itself, but also the broader socio-economic divides that lie at the root of the achievement gap.
I am grateful to the Higher Education Academy, which has generously contributed to the funding of this project with a Teaching Development Grant (Round 7).
Aarón Alzola Romero is a Lecturer in Classical Studies at the Open University (UK), where he researches the application of distance teaching methods to the study of the Ancient World. His principal areas of interest in pedagogy are Enquiry Based Learning, Virtual Learning Environments and mobile learning. E-mail: a.alzola-romero@open.ac.uk