VOL. 32, No. 1 2016
This article focuses on the integration conditions of a self-regulation tool in a collaborative distance-learning environment. An experimental study was conducted to address this issue. This study was conducted as part of a program of practical classes taught remotely with a group of 108 master’s degree students and with a two-variable factorial plan. The first variable was about the incentive given to students to use the self-regulation tool. The second variable brought the students to adopt different modes of organization for completing their task. The analysis of the results shows that the students who had to plan their work spontaneously used the tool more than those who negotiated their schedule. It also shows that the students encouraged to use the tool completed the training more quickly and were more efficient in their teamwork. Moreover, this study suggests some interaction between the two variables. Students from the spontaneous schedule group, who were also encouraged to use the self-regulation tool, reached a higher level of collaboration efficiency (work quality/time used).
Cet article se concentre sur les conditions d'intégration d'un outil auto-réglementé dans un environnement collaboratif d'apprentissage à distance. Une étude expérimentale a été menée pour aborder cette question. Cette étude a été réalisée dans le cadre d'un programme de cours pratiques enseignés à distance avec un groupe de 108 étudiants à la maîtrise et avec un plan factoriel à deux variables. La première variable était sur la mesure incitative donnée aux étudiants à utiliser l'outil d'auto-réglementé. La deuxième variable a amené les étudiants à adopter différents modes d'organisation pour effectuer leur tâche. L'analyse des résultats montre que les étudiants qui ont eu à planifier leur travail spontanément ont utilisé l'outil plus que ceux qui ont négocié leur horaire. Elle montre aussi que les étudiants encouragés à utiliser l'outil ont terminé la formation plus rapidement et étaient plus efficaces dans leur travail d'équipe. De plus, cette étude suggère une certaine interaction entre les deux variables. Les étudiants du groupe de planification spontanée, qui ont également été encouragés à utiliser l'outil d'auto-réglementé, ont atteint un niveau plus élevé d'efficacité de la collaboration (qualité du travail / temps utilisé).
![]()
This work is licensed under a Creative Commons Attribution 3.0 Unported License.
For several years, collaborative distance learning has been growing more and more popular, supported by the advance of interactive technologies. In a situation of collaborative face-to-face activities, learners retain a direct and permanent perception of the others in the classroom and their actions. In contrast, in a context of collaborative distance learning, the learner is required to interact in a virtual environment. However, the communication tools (forums, chat, e-mail, etc.) cannot convey the richness of direct exchanges perfectly. This situation creates difficulties for the individuals involved in distance interaction since the lack of information about the perception of the other learners’ activities creates confusion. In an attempt to identify and understand this phenomenon in distance learning, research in educational technologies emphasizes the concept of “awareness”.
For Dourish and Belloti (1992), this collective awareness is characterized by the learners’ knowledge and understanding of their peers’ activities, which provides a context for their activity, and which eases the coordination of collective and collaborative tasks (Gutwin and Greenberg, 2002). Jermann and Dillenbourg (2008) fully agree with this idea. For them, the collaborative learning environment should provide access to data that tells learners where they are in their work process. From a pedagogical point of view, visualization of information can be associated with a metacognitive activity to the extent that learners have the opportunity to analyze their environment, make decisions and then to assess the consequences. In a way, this ability to trace their activity stimulates the students’ use of self-management strategies and this allows them to define goals. Regarding this notion of sharing traces, Clark and Brennan (1991) provide an interesting contribution in the context of their work in psycholinguistics. According to these authors, several partners can adapt and plan their behavior more easily according to what they know about each other. This mutual knowledge facilitates what is called “grounding” (shared understanding).
Grounding is the principle according to which the partners can provide a common basis, on which they rely throughout the whole interaction. In this perspective, Gutwin and Greenberg (2002) put forward the concept of “workspace awareness” which is the sum of the knowledge that a person has of the workspace in which they operate with others. These authors distinguish the elements of awareness relating to the present (synchronous) or past events (asynchronous). Synchronous information may include the location of a learner in the shared space or the activities they are performing. Asynchronous information is related to the history of the learners’ activities and, notably, enables an individual to learn about the activities performed in the environment since their last connection.
While the principle of awareness used to be defined ex negative, as an artifice seeking to create the illusion of face-to-face interaction, the recent literature tends to highlight the importance of offering tools that enable the display of information directly connected to social and cognitive mediation (Buder, 2010). Compared to a face-to-face situation, information is more easily observable in a digital environment thanks to the ability to digitally track the learning process. To understand this complex process, we can refer to Leinonen, Järvelä & Häkkinen (2005). Starting from analyses of the interactions within collaborative groups, the authors distinguish two levels of self-regulation at the interpersonal level: co-regulation and shared regulation. Shared regulation refers to the situation where a member (or several members) controls the activity of the whole group. This form of regulation can relate to the planning of the tasks to be carried out, and the level of progression by the group in the learning process (Saab, 2012). These forms of self-regulation can be qualified as external, because they relate to the support of the group and the environment. According to Saab (2012), the difficulty in a CSCL environment is that learners can control themselves very well on an individual level but may not to be able to manage the aspects of co-regulation or shared regulation.
From a pedagogical point of view, the availability of visual representation of information in digital environments can help co-regulation and shared regulation. Visual representation initiates a mechanism for feedback. It concerns the processing of the task and is more effective when managed immediately (Hattie & Timperley, 2007). It can be considered that the visualization obtained starting from an automated data-processing method makes it possible to provide learning feedback “just in time”. With this sharing principle, visual feedback can then play a mediation role within the group, as the members of the group can more easily refer to the visualization to discuss a problem. Visualization makes it possible to reduce the variance of perception of the communication or coordination problem. It makes it possible to initiate a step of shared evaluation and, thus, to fill the possible variations that exist between the partners.
Some authors consider that visualizations are a feedback of information that also has an effect on the motivation of learning (Janssen, Erkens & Kirschner, 2011; Michinov & Primois, 2005). Learners in such educational groups have a constant need to evaluate their positions compared to the others at the time of doing a particular task involved in an activity. This behavior constitutes one of the important engines of interpersonal relationships. Highlighting what has or has not been completed is information which enables learners to set goals directed towards the completion and control of the task. While by directing the learners to consider their behavior with respect to the task, visualization can positively influence the perception of their part in the task. There is a consensus within the CSCL community that it is necessary to visualize the learning process through the exploitation of the traces left by the learners throughout the course.
While numerous monitoring tools exist to answer this need for shared metacognition, Salonen, Vauras and Efklides (2005) have already implemented and positively evaluated distance-learning situations by comparing different types of situations (using a tool versus not using a tool). Janssen, Erkens and Kirschner (2011), however, have expanded on many questions about the way the tool should be made available to learners. From a methodological point of view, it would be useful to design an experiment around the following question: "how can tools be integrated in a relevant way?" Therefore, this article is primarily concerned with adding some elements to help answer this question by studying, more particularly, the effect of various modes of integration of a monitoring tool on the learning process in a collaborative environment in a real training context.
In this section, the different learning tasks, the learning environment and the three research questions will be described.
The context is the practical class organized on the platform Esprit for university students following the course “use of TIC in education” in the master’s degree program of the University of Mons. On the occasion of this practical class, an activity entitled "The computer, a support for learning" was designed. The purpose of the task was to engage the students in experimenting with, and criticizing, educational software programs based on different models of learning. This activity was envisaged as a collaborative approach within an environment of distance learning that allows students to concretize the theoretical aspects approached during their classes. The educational script envisaged for this practical class consisted of a sequence of seven specific activities that the students had to complete one after the other. The first three were meant to be completed individually and were the prerequisites for the following four group-based activities. For every step of the scenario, groupware was provided for the students to submit the expected production. The first activity required all learners to introduce themselves to the other members of their group by providing a profile to be completed and uploaded to the team’s forum. During the second and third activities, the task consisted of testing and analyzing two learning software programs based on different models of learning (behaviorist versus constructivist). These two activities allowed the student to formulate their point of view before presenting, and arguing, it to the other members of the group during the following steps of the script. The fourth and fifth activities gave the students the opportunity to share their individual questionnaires, which were completed during the second and third activities. This exchange was designed to introduce discussion within the group and led the students to complete the analysis of all the software collectively. In the last activity, each team was asked to choose one of the types of software for evaluation. This choice required a preliminary negotiation within the team. This task was based on a precise description of the chosen software, as well as on a complete statement of its qualities and flaws.
From the supervision level, the role of the tutor consisted of answering the potential student questions using the team’s forum or by e-mail. The requests formulated by the students generally concerned technical advice related to the use of the educational software presented at the beginning of the training (downloading, installing and launching of the programs). The tutor’s intervention did not concern the exchanges within the groups.
Given this educational scenario, a specific learning environment, which integrated various tools that foster collaboration (groupware, galleries, forums, chat rooms), was developed to help the learners’ progress in the training and to offer them a space for completing the various challenges in the proposed activities.
In this collaborative environment, an awareness tool was implemented which was centered on the history of the activities. This tool, called "Dashboard" (Figure 1), provided the students a global view of the learning sequence while also displaying their progress in the training. Every cell of the table is associated with a learner and with an activity of the educational scenario. A horizontal reading of the information in the cells shows the progression of every learner or every team in the various proposed tasks (status of the activities, the frequency of use of communications tools, number of messages within the group, the number of messages of each student, etc.). A vertical reading gives information about the state of progress of an activity (accepted, to revise, etc.) for all the students.
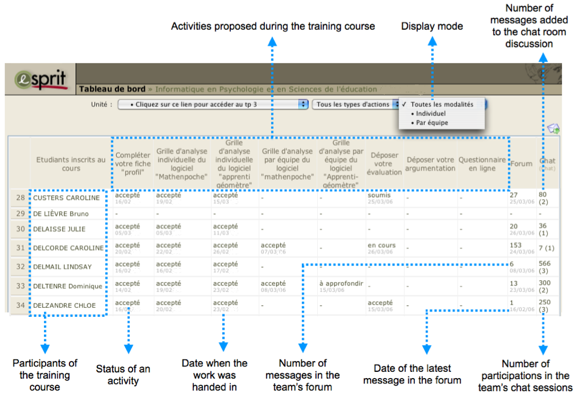
Figure 1: Activity dashboard.
In order to evaluate the use of the dashboard, the study used a factorial design considering two independent variables.
The first variable considered the impact of the how the learners were stimulated to use the dashboard, through messages on the forum and the given instructions. De Lièvre, Depover and Dillenbourg (2006) showed that the incentive to use the support tools in a learning environment stimulates the learner to use them more when the situation requires it. The present study considered the impact of an incentive procedure given to the learners to take advantage of the awareness tool. Concerning the stimulation of learners to use help tools, we can refer to the concept of ‘scaffolding’ defined by Wood et al. (1976) as the control of ‘aspects of the task which are initially beyond the student’s capabilities in order to allow him to concentrate on those which are not beyond his capabilities’. (p. 9)
In this study, some students were informed of the presence of the tool in their instructions for every new step of the scenario and were able to read the tool via a hypertext link. Other students were not encouraged to use the tool, and were only informed about the presence of the dashboard at the beginning of the activity and did not have the various reminders to stimulate them to use the dashboard.
The second variable, relative to the planning of the teams’ work, distinguished three modalities for planning the various tasks they had to complete during the training: compulsory schedule, negotiated schedule and spontaneous schedule. In the case of the first modality, the students received a schedule with deadlines associated with the various tasks. The second modality forced the students to negotiate their schedule within their group, to develop a schedule for the various tasks and to submit them on the team’s forum. The last modality left the learners free to organize themselves as they wished for the various tasks; only the final deadline was stipulated in their instructions.
The study participants involved a group of 108 students. Six experimental groups of 18 students each (as shown in Table 1) supported the investigation of the incentive/no incentive variable by three schedule methods (fixed, negotiated, spontaneous), for a total of six conditions. For this work, the students collaborated in triads. Each group consisted of six smaller groups of three students. These six groups of three were then distributed randomly according to the six conditions corresponding to the crossing of both variables (incentive vs no incentive) and three scheduling modalities, as shown in Table 1. One of the goals of the study was to determine whether these modes of tutoring could positively or negatively influence distance learners’ use of the dashboard.
Table 1. Factorial Design: Distribution of Participants
|
Incentives to use the dashboard (I) |
No incentives to use the dashboard (NI) |
Fixed schedule |
I*F Condition 1 |
NI*F Condition 2 |
Negotiated schedule |
I*N Condition 3 |
NI*N Condition 4 |
Spontaneous Schedule (S) |
I*S Condition 5 |
NI*S Condition 6 |
The analysis of the experimental device was divided into three complementary questions. The first question investigated the use of the dashboard according to the experimental conditions. Questions 2 and 3 dealt with the impact of the integration modalities of the monitoring tool on the learning process and were designed to bring to light a possible mediating effect of the monitoring tool on this learning process.
Research Question 1
Is the dashboard used differently according to the different experimental conditions? To answer this question, the frequency of use of the dashboard by every learner was taken into account. Every time a student opened the tool it was recorded in a database that was integrated into the working platform. Within the framework of this study, only opening the dashboard, which synthesized the individual and collective information under the shape of a time line, was taken into account.
Research Question 2
Does the time taken to complete the training by the collaborative teams vary according to the assigned condition? Through this second question, the time needed to fulfil the training was considered. Here the dashboard modeled a timeline with the various stages of the educational sequence.
In distance training, teams have more problems with temporal coordination because of mediated communication and the lack of temporal benchmarks (Dillenbourg, 2002). Balduf (2009) highlighted that the ability to manage time is positively related to academic performance. Michinov et al. (2011) also underlined the negative link between a high degree of procrastination and success in learning. In their works, Romero, Tricot and Mariné (2009) showed, moreover, that displaying the time spent on a task could have a positive impact on the management of collective time.
The tool integrated into the chosen environment was potentially useful in coordinating the collaborative work (Gutwin & Greenberg, 2002). To approach the issue of time in this study, the reference was set as the number of days spent between the beginning of the training and the moment when the document associated with the last activity by the team was submitted.
Research Question 3
Does the quality of the collective products of learning, as well as the collective efficiency, differ according to the conditions of the integration of the monitoring tool? To measure the quality of the learning, four collective productions submitted at the end of Steps 4, 5 and 6 were assessed (sharing of individual work within the group) as well as that of Step 7 (choice of the software and argumentation within the group). To objectively assess all of these assignments, a criterion-referenced assessment grid was used, making it possible to obtain a global grade for each team. The marking of the 144 documents (4 documents x 36 groups) was done anonymously, that is, by having no reference relative to the various experimental groups. From this observation, the link between the quality of the learning and the necessary duration to complete the training was also investigated. An efficiency index was obtained by dividing the global mark for every team by the number of days needed to complete the training.
The results of the applied variance analysis did not indicate a significant effect of the "incentive" variable on the average use of the dashboard (F = 0.960; p = 0.329) for both experimental groups (the incentive and the no incentive groups). Concerning the scheduling, a value of F was obtained, which indicated a significant difference between the average use for the groups according to each schedule variable (F = 3.528; p = 0.033). At the level of the combined effect of both variables, the variance analysis provided a non-significant value for F (F = 1.033; p = .360). A comparison of the averages by means of a student test showed a higher average use of the dashboard (average = 8.58) by the groups having a final deadline and a lower average use of the awareness tool (average = 3.61) in the groups working with negotiated schedule (t = 2.692; p = 0.009). This significant difference can be explained by the fact that the students who planned their tasks had, with their schedule, a common reference table for the team. They probably did not feel the same necessity to refer to the dashboard, contrary to the teams only having the final deadline.
Henri and Lundgren-Cayrol (2001) highlighted the importance of negotiation within the group before initiating a collaborative approach and considered that this consensual stage favors the subsequent self-management of the group in its collaborative experience.
Table 2. Use of the Dashboard
|
Schedule |
Mean |
Standard Deviation |
Incentive |
Fixed |
6.33 |
6.10 |
Negotiated |
3.56 |
4.49 |
|
Spontaneous |
10.89 |
11.10 |
|
Total (incentive) |
6.93 |
8.19 |
|
No Incentive |
Fixed |
6.33 |
10.02 |
Negotiated |
3.67 |
2.82 |
|
Spontaneous |
6.28 |
9.51 |
|
Total (No incentive) |
5.43 |
8.08 |
|
Total |
Fixed |
6.33 |
8.18 |
Negotiated |
3.61 |
3.67 |
|
Spontaneous |
8.58 |
8.14 |
In the study, the absence of a schedule forced the groups with a free deadline to rely more on the dashboard, to become informed about the activity of their individual partners, and to coordinate their various collaborative tasks (Gutwin & Greenberg, 2002). As such, by posting the information of the other collaborative teams, the tool offered the groups a means of spontaneous schedule with the possibility to check the way the other collaborative teams progressed in the training, and a way to evaluate their own state of progress according to a logic of social comparison (Michinov & Primois, 2005).
Table 3 shows that for the groups of incentive students (x = 39.72) the average duration of the completion of the training course was shorter than for the groups of no incentive students (x = 42.83). This difference was statistically significant (F = 4.236; p = .048). The variable “schedule” (F = .820; p = .450) did not seem to have any effect, nor did there seem to be an interaction between the two variables (F = 2.562; p = .094).
Table 3. Time Needed to Complete the Training (Number of Days)
|
Schedule |
Mean |
Standard Deviation |
Incentive |
Fixed |
39.66 |
6.68 |
Negotiated |
42.66 |
2.25 |
|
Spontaneous |
36.83 |
4.75 |
|
Total (incentive) |
39.72 |
5.22 |
|
No Incentive |
Fixed |
44.50 |
0.54 |
Negotiated |
41.00 |
6.89 |
|
Spontaneous |
43.00 |
1.78 |
|
Total (No incentive) |
42.83 |
4.14 |
If the link between the number of days necessary to complete the training and the actual use of the dashboard on the whole sample of learners was considered, a negative correlation between the number of days of training and the number times the dashboard was accessed was obtained (r = 0.388; p = 0.002). This significant relationship could show that the more the dashboard was used, the more the duration of training decreased. This seemed to support the claim that the dashboard constituted an effective time management support tool.
This result is especially relevant, as time management often constitutes a real difficulty for the learners involved in distance learning. A display of the chronology of the events, therefore, constitutes an indispensable structuring tool for the collaborative groups (Gafni & Geri, 2010; Alavi & Dillenbourg, 2012). Even though this link was distinguished according to both experimental groups under the "incentive” variable, a more significant link was obtained for the groups encouraged to use the tool (r = 0.634; p = 0.005) and no correlation was seen for those not encouraged to (r = 0.041; p = 0.870). On the basis of these results, the hypothesis is that pro-activity to use the tool helped the learners to become more aware of the advantage of using it to monitor time within their team, suggesting that learners use help tools when they realize their advantages.
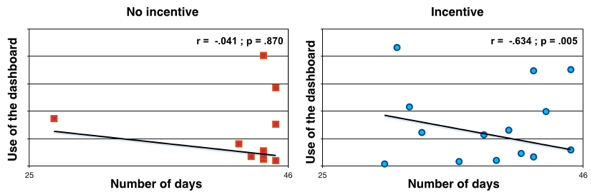
Figure 2: Correlations between the number of days and use of the dashboard.
Collective Effectiveness and Efficiency
With regards to effectiveness, the variance analysis indicated no difference of quality in the production between the experimental groups. The incentive did not seem to have any effect (F = 2.356; p = 0.135), neither did the schedule (F = 0.504; p = 0.609), nor the interaction (F = 2.570; p = 0.093). As to efficiency, the results in Table 4 show several tangible results. The groups encouraged to use the dashboard were more efficient (x = 1.65). This difference showed in the statistical plan (F = 5.681; p = 0.024).
Table 4. Collective Efficiency
Incentive |
Schedule |
Level of Efficiency |
Standard Deviation |
Incentive |
Fixed |
1.74 |
.28 |
Negotiated |
1.41 |
.10 |
|
Spontaneous |
1.80 |
.29 |
|
Total (incentive) |
1.65 |
.28 |
|
No incentive |
Fixed |
1.35 |
.26 |
Negotiated |
1.63 |
.45 |
|
Spontaneous |
1.30 |
.10 |
|
Total (No incentive) |
1.43 |
.32 |
While no difference appeared between the experimental groups defined by the variable "schedule" (F = .050; p = .008), an interaction effect between the two variables was noted in the level of efficiency (F = 5.647; p = .008). The paired comparisons indicated that there were differences between both groups (x = 1.80 versus x = 1.30) with a free schedule and defined by the “incentive" variable (t = 3.833; p = .003) as well as between both groups (x = 1.74 versus x = 1.35) with a fixed schedule and defined by the "incentive" variable (t = 2.426; p = 0.036). Besides, a cross-analysis between the use of the dashboard and the degree of efficiency showed that the most efficient experimental groups (incentive students with a fixed schedule and incentive students with a spontaneous schedule) were also the ones who relied more on the dashboard during the training. These results were consistent with those of De Lièvre et al. (2006), showing that pro-activity had an amplifying effect on the use of the support tools in the learning environments when these tools met the needs of the learners in the learning context. In these two experimental groups, it can indeed be considered that the tool of self-regulation represents a contextualized support tool because its content is more connected to the problems of the learner, in comparison with the groups working according to a negotiated schedule and who have their own temporal framework established at the beginning of training.
This study aimed to identify how the self-regulation tool should be integrated in the context of collaborative distance learning by manipulating two educational variables: the schedule and the incentive. In terms of the use of the dashboard, the experimental groups were sensitive to the schedule modality. The awareness tool was, indeed, not used in the same way by the learners, depending on how their groups planned the collaborative work. The results show clearly that the organizational context influenced the use of the asynchronous awareness tool integrated into the environment.
It was also noted that the groups having negotiated their schedule had a significantly lower use of the dashboard than the other experimental groups. To explain this situation, the fact that the negotiation of a preliminary schedule probably allowed these students to establish their own framework, and, at the same time, achieve a better awareness of the work to be completed, was considered. The logic of compensation between the organizational modalities and the use of the tool was thus set in the learning environment. This equilibrium observed in the study was consistent with the findings of Gutwin and Greenberg (2002). These authors specify that the elements of awareness are particularly useful during the implementation of tasks where no prior articulation between the various tasks was envisaged. This analysis supports the works of Kraut, Fish, Root and Chalfonte (2002). A link can indeed be established between the achieved results and the model of interpersonal communication proposed by these authors. For them, coordination can be envisaged in two different ways in a shared workspace. The first one corresponds to explicit communication in the way of working and to plan the tasks to be completed within a group. The second one, which is more informal, is obtained on the basis of the equipment shared in the environment through the use of the tools that the learners have at their disposal. In the chosen experimental plan, the first approach corresponds to the groups having negotiated a schedule in the forum beforehand while the second one corresponds to the groups benefitting from a fixed schedule, or those having only the final deadline.
From the point of view of supervision, it can be considered that the tool can take on organizational aspects within the collaborative group. While favoring its autonomy, it can possibly reduce the task of a human tutor in such contexts where there are a high number of students to supervise.
Concerning the incentive variable, the significant effect of the incentive on the efficiency and the duration of the learning process, makes it useful for teachers to think about the wording of the task given to the learners in relation to the self-regulation tools available. If the teacher wants a specific tool to be implemented by the learners in training because they consider that the context of the training requires it, it is then necessary to encourage the learners to use it from the beginning. The stimulation has to mention the existence of the tool and to highlight its utility in order to promote its use.
During the training process, it can also be useful to remind the learners that the tool exists when they are confronted with an organizational difficulty or when they are not conscious enough of their communication or coordination difficulties. This approach can take the form of a reminder in the wording of the task or by a procedure of notification using communication tools. This pro-activity triggered by a tutor will facilitate the leaners’ awareness of the real potential of the tools supplied to progress in the task. On the contrary, when support tools are provided without a specific incentive to use them in a distance-learning context it will probably yield a more reduced usage of these supports and will probably inhibit the positive effect of these aids in favoring the self-regulation of the learners.
This study highlights that it is not enough to implement a dashboard to stimulate self-regulation in a CSCL environment. It is also relevant to think of the methods that the tutor employs to guide its use in the environment. An effect of compensation does indeed appear between the use of the tool and the type of action taken by the tutor regarding scheduling. When the tutor does not manage the scheduling, the students use the dashboard more. From these observations, it seems that the tool can help the tutor when they are confronted with a large number of groups to manage. This type of tool is essential for providing a global view of the tasks carried out in an environment like a MOOC, and for regulating the learning process.
In the future, it is essential to continue research around the use of the help tools in a learning environment. There should be a particular focus on the impact of their use, on interactions within the group (forums, chat-room, etc.), and on individual effectiveness.
Alavi, H. &, Dillenbourg, P. (2012). An Ambient Awareness Tool for Supporting Supervised Collaborative Problem Solving. IEEE Transactions on Learning Technologies, 5(3), 264-274.
Balduf, M. (2009). Underachievement Among College Students. Journal of Advanced Academic, 20, 274-294.
Buder, D. (2010). Group Awareness Tools for Learning: Current and Future Directions. Computers in Human Behavior, 27(3), 1114-117.
Clark, H.H. & Brennan, S.E (1991). Grounding in Communication. In B. Resnick, J. Levine, & M.Teasley (Eds.), Perspectives on socially shared cognition (pp. 127-149), New York: American Psychological Association.
De Lièvre, B., Depover, C., & Dillenbourg, P. (2006). The Relationship Between Tutoring Mode and Learners’ Use of Help Tools in Distance Education. Instructional Science, 34, 97-129.
Dillenbourg, P. (2002). Over-scripting CSCL: The risks of blending collaborative learning with instructional design. In P. A. Kirschner (Ed.), Three worlds of CSCL: Can we support CSCL, (pp. 61-91). Heerlen: Open Universiteit Nederland.
Dourish, P., & Belloti, V. (1992). Awareness and Coordination. In Shared Work Spaces, ACM Conference on Computer-Supported Cooperative Work CSCW'92, (pp. 107-122). Toronto, Canada.
Gafni, R., & Geri, N. (2010). Time Management: Procrastination Tendency in Individual and Collaborative Tasks. Interdisciplinary Journal of Information, Knowledge, and Management, 5, 115-125.
Gutwin, C., & Greenberg, S. (2002). A Descriptive Framework of Workspace Awareness for Real-Time Groupware. Computer Supported Cooperative Work, 11(3-4), 411-446.
Henri, F., & Lundgren-Cayrol, K. (2001). Apprentissage collaboratif à distance : pour comprendre et concevoir des environnements d’apprentissage virtuels. Sainte-Foy, Canada : Presses de l’Université du Québec.
Janssen, J., Erkens, G., & Kirschner, P. (2011). Group Awareness Tools: It’s What You Do With it That Matters. Computers in human behavior, 27(3), 1046-1058.
Jermann, P., & Dillenbourg, P. (2008). Group Mirrors to Support Interaction Regulation in Collaborative Problem Solving. Computers & Education, 51(1), 279-296.
Kraut, R.E., Fish, R. Root., R., & Chalfonte, B. (2002). Informal Communication in Organizations: Form, Function, and Technology. In S. Oskamp & S. Spacapan (Eds.), Human reactions to technology: Claremont symposium on applied social psychology, (pp. 145-199). Beverly Hills: Sage Publications.
Leinonen, P., Järvelä, S., & Häkkinen, P. (2005). Conceptualizing the Awareness of Collaboration: A Qualitative Study of a Global Virtual Team. Computer Supported Cooperative Work, 14(4), 301-322.
Michinov, N., & Primois, C. (2005). Improving Productivity and Creativity in Online Groups Through Social Comparison Process: New Evidence for Asynchronous Electronic Brainstorming. Computers in Human Behavior, 21(1), 11-28.
Michinov, N., Brunot, S., Le Bohec, O., Juhel, J., & Delaval, M. (2011). Procrastination, Participation, and Performance in Online Learning Environments. Computers & Education, 56, 1-10.
Romero, M., Tricot, A., & Mariné, C. (2009). Effects of a Context Awareness Tool on Students’ Cognition of Their Team-Mates Learning Time in a Distance Learning Project Activity. In C. O’Malley, D. Suthers, P. Reimann & A. Dimitracopoulou (Eds.), Proceedings of computer supported collaborative learning practices. Atlanta: USA.
Saab, N. (2012). Team Regulation, Regulation of Social Activities or Co-Regulation: Different Labels for Effective Regulation of Learning In CSCL. Metacognition and Learning, 7(1), 1-6.
Salonen, P., Vauras, M., & Efklides, A. (2005). Motivation and Affect in the Self-Regulation of Behavior – Social Interaction: What Can itTell Us about Metacognition and Co-regulation in Learning? European Psychologist, 10(3), 199-208.
Gaëtan Temperman is a professor at the Université de Mons. E-mail: gaetan.temperman@umons.ac.be
Bruno De Lièvre is a professor at the Université de Mons. E-mail: bruno.delievre@umons.ac.be
Joachim De Stercke is a professor at the Université de Mons. E-mail: joachim.destercke@umons.ac.be