VOL. 30, No. 2
In 2013, the Student Centre at The University of Tasmania began researching the development of distance learning support. A survey was designed as part of this endeavour, which attracted 1002 responses. The survey’s broad context focused on the primary drawbacks and benefits of distance education in general and sought to identify emergent themes characterising students’ experience with distance education. The narrow context targeted utilization of the university’s online services. This paper presents key broad context results, providing a ground for further research informed directly by student experience. Certain aspects of the analysis are explicated through the lens of existing theoretical frameworks, particularly those of Moore, Tinto, and Holmberg. But the results also contribute directly to theory by revealing complexity and internal differentiation in the dominant themes of ‘connection’, ‘contact’, ‘isolation’ and ‘consideration’; and reinforcing the student perspective as a key dimension of theoretical conceptualisations of distance education itself.
En 2013, le Centre étudiant de l'Université de Tasmanie a commencé à étudier le développement du soutien à l'apprentissage à distance. Un sondage a été conçu dans le cadre de cette initiative et a attiré 1002 réponses. Le vaste contexte du sondage a porté sur les principaux inconvénients et avantages de l'enseignement à distance en général, et a cherché à identifier des thèmes émergents caractérisant l'expérience des étudiants avec l'enseignement à distance. Le contexte étroit a ciblé l’utilisation des services en ligne de l'université. Ce document présente les principaux résultats d’un contexte diversifié, fournissant une raison pour plus de recherche informée directement par l'expérience de l'étudiant. Certains aspects de l'analyse sont expliqués par l’entremise de cadres théoriques existants, en particulier ceux de Moore, Tinto, et Holmberg. Cependant, les résultats contribuent aussi directement à la théorie en révélant la complexité et la différenciation interne dans les thèmes dominants de « connexion », « contact », « isolement » et « considération »; et en renforçant la perspective de l'étudiant comme une dimension clé des conceptualisations théoriques de l'enseignement à distance lui-même.
![]()
This work is licensed under a Creative Commons Attribution 3.0 Unported License.
In 2013, the Student Centre at The University of Tasmania began researching the development of online learning support. Initially, the research focused on increasing access and investigating modes of delivery of student support online, but it was quickly decided that a vital part of the overall development of support for distance students was the discovery of just what distance students themselves thought and felt about their experience. A survey was then designed as part of an overall endeavour to facilitate equity and to hear directly from distance students themselves.
Thus, the survey sought to hear from students in two contexts: one broad and one narrow. The broad context focused on the primary drawbacks and benefits of distance education in general. Distance education is understood here as ‘the family of instructional methods in which the teaching behaviours are executed apart from the learning behaviours … so that communication between the teacher and the learner must be facilitated by print, electronics, mechanical, or other devices” (Moore, 1973, p. 664), with the principle of ‘facilitation’ being online courses, delivered or managed by a lecturer/tutors. Broad context questions were as open as possible in order to begin to uncover some key features capable of characterising the experience of students undertaking distance education and to allow the voice of students themselves to determine the agenda for further research in the field. The narrow context targeted student’s utilization of services offered online at The University of Tasmania.
This paper focuses on the survey’s broad context, presenting and discussing principal results. Broadly speaking, there are three existing theoretical frameworks within which these results can be situated: Moore’s theory of transactional distance (Moore, 1973, 2013), Tinto’s conceptual schema for dropout from college (Tinto, 1975), and Holmberg’s theory of guided didactic conversation as a pervasive characteristic of successful distance education (Holmberg, 1989, p. 43).
The first of these characterises distance education and different learning-teaching scenarios according to the interaction of three primary elements: dialogue, structure, and autonomy (Moore, 2013, p. 68). The second identifies a set of factors influencing student persistence and dropout, focusing in particular on the role of ‘processes of interaction’ between students, students and teachers, and students and their institutions. The third argues that ‘empathetic’ conversation and guidance from teachers (or as a feature of course content itself) enhances meaningful or ‘real’ distance learning (Holmberg, 1989, pp. 42-43).
All three theories will be referred to in what follows. At times, the results verify the theories, insofar as students’ self-reported experience accords with theorised student characteristics, overviews of process, or the effect of friendly conversation. At other times, the theories provide for a deeper understanding of the results. But, ultimately, the hope is that the results add another dimension to such existing theoretical frameworks – one which focuses, not on student characteristics per se (as in Tinto, 1975, pp. 99-111), nor on the potential effectiveness (or otherwise) of any particular features of learning-teaching in a distance context (as in, for example, Moore, 2013, p. 67) and Holmberg (1989, pp. 42-43), but instead on what it is like, today, to be a student engaging in education at a distance. An appreciation and understanding of the former are all-important for a clear comprehension of distance education itself and, for example, of the ways in which persistence and engagement may best be achieved therein. But, the hope is that this research begins the work of bringing the student perspective into the overall theoretical picture by the identification and close examination of a set of core properties of student experience. This extra dimension is capable of bringing still further clarity and completion to the frameworks through which we seek to comprehend just what this mode of study is and what it means for both teachers and students.
Thus, while the above three theoretical frameworks can aid an understanding of just what distance students experience, hearing direct from students themselves can, in turn, explain and enrich the theories. Such work also updates the frameworks, for instance, by tracking shifts in their relevance across time. Although they have been utilised extensively in the literature since their inception (see Moore, 2013, pp. 77-80 for a comprehensive coverage of such utilisation), these frameworks were postulated in the 1970s and 1980s when distance education was still in its infancy. And there are important differences between the characteristics and experiences of distance students then and those undertaking distance study today.
For example, results here and research done elsewhere (Wallace, 1996; 2013) suggest that students ‘choosing’ distance education today are less likely to be doing so as autonomous learners seeking to expand their knowledge, than they were in the ‘70s (Moore, 1973, p. 674). Indeed, for many students today, the decision to undertake distance education may best be characterised as a necessity, rather than as a choice at all, given the lifestyle and economic constraints apparently compelling that ‘choice’. The analysis of Q3, discussed further below, shows that the responses offering ‘flexibility’ as the best feature of distance education tended also to mention ‘necessity’, ‘self-determination’ or ‘location’. Only 15 of 135 responses tested for shared coding also directly mentioned ‘positive’ features in their response.
Thus, research on student experience today can inform which theoretical concepts are most relevant now, or turn out to be more nuanced and complex than first supposed. There has been a small amount of recent research on distance student experience, but it has been comparatively theory-driven (seeking to verify particular hypotheses, rather than add to an understanding of distance education itself (Muilenburga & Bergeb, 2005). And much has either focused on blended learning or has not discriminated between wholly online and blended learning (Sun, 2014). A possible exception is the study: “Quality, learning spaces, social networking, connectedness and mobile learning: exploring the student voice in online education”, the key objective of which was: “to develop a Student Experience Kit (SEK) … [drawing] upon ‘student voices’ (online learners)” (Andrews & du Toit, 2014). But, as Andrews and Tynan note, there is a “paucity of information available about the distance learner in general” (2010, p. 61), which reinforces the importance of continuing research in this area.
It should be noted, though, that there are also important differences between this research and Andrews’. Andrews’ project involved a number of specific aims: e.g., to understand students’ experience of ICT, and to challenge specific pre-existing notions about distance students, especially regarding diversity and globalisation (Andrews 2010). By contrast, the aim here is very general: to discover features of student experience from as wide a context as possible.
Indeed, the broad context incorporates a number of research areas within the field, including ‘learner characteristics’, ‘student psychology, motivation and characteristics’, ‘interaction and communication’ (in [distance and online] learning communities), and ‘distance students, their milieu, conditions, and study motivations’ (Zawacki-Richter, 2009, pp. 2-4, 15) It seeks to understand core components of human experience in a given situation, posing as few hypotheses regarding learners, communities, and circumstances as possible, and focusing instead on the experience of being a distance student per se. As such, it also sits comfortably at the intersection of a number of other research fields, including conceptual, philosophical and purely theoretical.
The research tool was a SurveyMonkey questionnaire. A link to the survey was sent out to students enrolled at the University of Tasmania who were identified as studying by distance. The method of identification was a student systems generated report, designed to return students who had been enrolled as distance in either Semester 1 or Summer School during 2013. There were 5,911 students on this initial list. An email was sent to all students on the list asking them to fill out the survey by clicking on the SurveyMonkey.com link, and outlining the purpose of the research. The email also included the ethics consent form.
Sample
One thousand and two students responded to the survey (≈17% response rate): most individuals completed the survey during April and May 2013, and responses were received up until the end of July 2013.
Of the respondents, 35.3% (N = 353) were enrolled in the Education Faculty at the university; 28.8% (N = 288) in Health Science; 13.2% (N = 132) in Arts; 10% (N = 100) in Business; 4.5% (N = 45) in the Australian Maritime Collage (AMC); 4.4% (N = 44) in Science, Engineering and Technology (SET); 0.6% (N = 4) in the Institute for Marine and Antarctic Studies; and 4% (N = 40) selected ‘other’ and specified another area (among the areas specified were: Fine Arts; Medicine; Paramedicine; Nursing; and Foundation, Preparation and Pre-degree courses. Further, 42.59% (N = 425) identified as ‘Postgraduate’; 39.28% (N = 392) as ‘Undergraduate’; 15.63% (N = 156) selected ‘I am in my first year as an Undergraduate’; 2.51% (N = 25) as ‘other’ and specified another category (among categories specified here were: University Preparation Programs; second degrees; Associate degrees; Diplomas; and Honours).
Initial Coding
Initial analysis was done manually, through coding individual responses by meaning types. The software package QSR-Nvivo was utilized throughout, along the lines described in Hutchison, Johnston and Breckon (2010). The approach taken was primarily a grounded one, with a general inductive methodology (Thomas, 2006). Meanings were mutually exclusive: i.e., where meanings were closely related, codes were double-checked to ensure items were coded at more than one code (Nvivo node) only if they expressed more than one meaning. Due to staffing and time constraints, coding was done by only one person. In an attempt to mitigate this limitation, tests were run for consistency across answers (e.g., 31.3% of responses coded at ‘unconsidered’ (Q4), and 42.4% of those coded at ‘consideration’ (Q5) were also coded at the other (respectively), indicating consistency of coding). Plans for the future include the provision of second-rater agreement for this data across a random selection of responses.
Generally codes were coarse grained, that is, in order to better establish broad themes, codes caught more rather than less content. For example, the code: ‘more or better quality resources’ (for responses to Q5) indicated both online and physical resources. Where finer grained coding also seemed called for (as in the latter case), this was noted for future follow up1.
The original number of nodes (between 10-27) was later reduced to around 8 by grouping into broad themes2 (using aggregation of sets of related nodes: e.g. in the example, aggregated nodes are shaded).
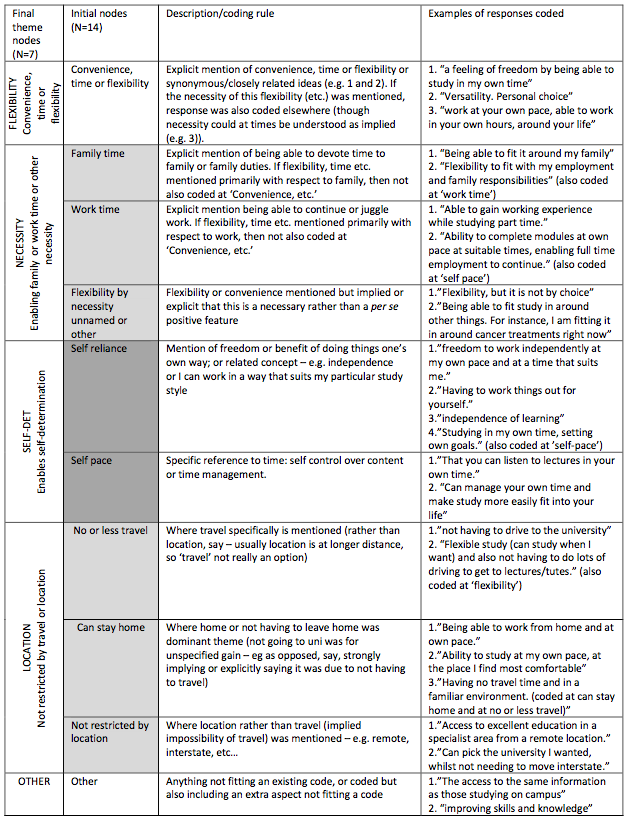
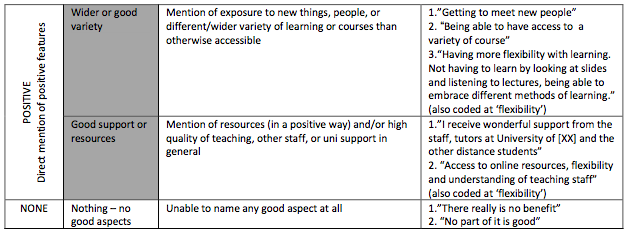
Detailed Example of Coding Process
Table 1: Coding for Q3
Initial analysis on open questions also included cluster analysis by word similarity: in Nvivo, nodes with high Pearson correlation coefficients cluster closely together, and those with lower Pearson coefficients correlation cluster further apart. Further exploration on correlations between themes included an investigation of shared coding between each code and the largest node for each question. Finally, matrix queries were run to discover correlations between codes on open questions and (some or all of): Q1; Q2; Q6 and Q11. Only some result summaries are given below. Note also that some summaries include full results, while others give ‘of note’ results only.
The survey questions were as follows:
The ‘open’ questions: 3, 4, 5, and 14, were the primary tool for the broad context enquiry. Hence, the following focuses particularly on the analysis of responses to these questions (brief summaries for other questions are provided below3). Mention of results from the narrow context occurs only where these impacted on or interrelated with the open questions.
Summaries of Coding and Initial Analysis on Open Questions
Q3 ‘What do you think is the best aspect of being a distance student?’
Number of responses = 976 (97.4%), Number of respondents who skipped this question = 26 (2.6%)
Summary of coding (FINAL PARENT CODE: [brief descriptor of parent code]: original child codes [grouped in parent]: N = number of references in a code. Final column is % of total responses to this question that were coded at the parent node.)
Table 2: Summary of Coding Q3
Q3: Best Aspect |
|||
Codes |
N parent |
N child |
% of total |
FLEXIBILITY: (convenience time or flexibility) |
493 |
|
50.5 |
POSITIVE: (direct mention of positive features) |
57 |
|
5.8 |
|
|
46 |
|
|
|
11 |
|
SELF-DET: (enables self-determination) |
145 |
|
14.9 |
|
|
52 |
|
|
|
93 |
|
LOCATION: (not restricted by travel or location) |
168 |
|
17.2 |
|
|
40 |
|
|
|
66 |
|
|
|
62 |
|
NECESSITY: (enables family or work time or other necessity) |
365 |
|
37.4 |
|
|
108 |
|
|
|
250 |
|
|
|
7 |
|
NONE: (there are no good aspects at all, or nothing, or none, or only doing it because I have to) |
27 |
|
2.8 |
OTHER |
21 |
|
2.2 |
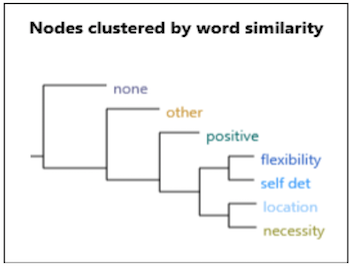 |
|
Figure 1: Word similarity and shared coding on main theme Q3
Moore points out that learners who undertake this mode of study are ‘compelled to accept a comparatively high degree of responsibility’ (Moore 1973, p. 666) for their learning. In some ways, the results here (specifically the themes of ‘self-determination’ and, to some extent, of ‘flexibility’) indicate that students themselves are aware of this and value their autonomy. But, as was briefly touched in the introduction, this is countered to some degree by the high cross-correlation between both ‘necessity’ and ‘location’ with ‘flexibility’. This may indicate to the contrary, by suggesting a lack of such awareness, or preparedness, for enforced autonomy, or simply an unwillingness to accept autonomy as the potential ‘cost’ of flexibility. While it remains generally true (since Moore’s original work in the 1970s) that with increased distance comes increased autonomy (1973, p. 670), we cannot assume that students who are compelled by circumstance or who choose distance education for practical or economic reasons will be, or even likely be, the ‘autonomous learners’ characterised by Moore and Holmberg in the 1970s and 80s (Moore 1973, pp. 668-669, Holmberg 1989, pp. 23-25).
To expand: in the 1970s and 80s, one of the primary reasons learners chose distance education was “the convenience, flexibility and adaptability of this mode of education to suit individual students’ needs” (Holmberg 1989, p. 24). The results here indicate that this much has not changed. But in the past, there was a clear indication that students choosing this mode had “a predilection for entirely individual work” and “saw themselves as independent and capable” (Homberg 1989, p. 24). The results here, along with the high correlation between the code ‘flexibility’ (Q3) and the code ‘isolation’ (Q4) (further discussed below) indicate that, for a significant portion of modern-day students, the attractiveness of ‘flexibility’ as a feature of distance education is tempered by necessity and so an appreciation of ‘flexibility’ cannot prima facie be taken as indicative of a preference for autonomous or independent learning.
Moore also points out that students who are not autonomous learners will do better in courses with less ‘transactional distance’ (i.e., relatively unstructured courses, with highly responsive teachers), while autonomous learners are “more comfortable with less dialogue … [and] highly structured course materials” (Moore 2013, pp. 71, 73). Thus, we could further account for some of the disparity in students’ self-reported experience of flexibility by supposing a disparity in the structure and responsiveness of their courses (in addition to the supposition of significant variation in respondents’ degrees of autonomy).
Further analysis on Q3 responses included checking for significant variation in the overall responses of different cohorts. SET (Science, Engineering and Technology) students were under-represented at ‘flexibility’ and ‘necessity’, and over-represented at ‘location’ and ‘self-determination’ (‘self-det’), suggesting this cohort may be more concerned with the latter two than the former two themes. The largest deviation was from ‘flexibility’ (for most faculties, approximately 50% of responses were coded here, compared with only 34% of SET responses). This might suggest that SET students are motivated to study by distance for reasons other than the usual. Just why this is the case needs further study.
No significant disparity was found between postgraduate and undergraduate representation in the codes generally, given 42.6% of respondents were postgraduate and 54.7% (N = 548) were undergraduate or first-year undergraduate (e.g., 50% of undergraduate and 48% of postgraduate responses were coded at ‘flexibility’). ‘Self-determination’ rated highly for postgraduates (15%) compared with undergraduates (13%). This is perhaps partly explained by the rate of undergraduate responses coded at ‘necessity’ (30.5%), compared to 29.6% of postgraduate responses coded there. It could be that the undergraduate distance students represent a (comparatively) mature age group. This is borne out by codes showing a high number had family and work commitments (compared with the postgraduate group): i.e., undergraduates mentioning family (N = 68: 12.4% undergraduates = 51, first year = 17) compared with postgraduates mentioning family (N = 38: 8.9%). A higher number mentioned work (N = 137: 25%: undergraduates = 97, first year = 40).
While this number was comparable with postgraduates who mentioned work (N = 108: 25.4%), it seems reasonable to suppose that the group of undergraduates represented here are at an age or life-stage comparable to postgraduate or mature age students (other studies also report this trend, e.g., Koch 2006). Further investigation on the themes ‘family’ and ‘work’ for all respondents revealed that 65 references (18.2% of total coded at either) were coded at both ‘family’ and ‘work’ (total coded at either = 358), indicating a significant portion of students overall had both work and family obligations. This, once again, suggests that the degree to which life commitments compel both undergraduate and postgraduate students to study by distance is an important area for further study.
Similar themes ran through the four most closely clustered nodes for responses to Q3 (see Figure 1) – suggesting possible common factors here. Note that the high percentage of cross-coding (coding at both of two codes) between ‘self-determination’ and ‘flexibility’ suggests common factors underlying these categories, which is in line with Moore’s hypothesis above.
Coding queries were also run to find patterns or commonalities in responses across questions. For example, an Nvivo report was run to find all respondents whose responses to Q3 were coded at ‘flexibility’ (N = 493) and to Q4 were coded at ‘isolation’ (N = 666). The number of individual codes returned by this report = 646, meaning 323 responses were coded at both these nodes in Q3 and Q4.
Thus, over half of respondents who felt that the best aspect of being a distance student was ‘flexibility’, also felt that the worst aspect of being a distance student was the lack of contact. A similar report found that the number of responses coded at ‘necessity’ in answer to Q3 and at ‘isolation’ in answer to Q4 = 388: i.e., 194 at both. The total number coded at necessity was 365, so 53.2% of responses coded at necessity were also coded at lack of ‘isolation’. So again, there is a comparatively high correlation between these codes, suggesting possible common factors between feelings of isolation and lack of choice or feeling compelled to undertake study in this mode. Some further evidence for this is the correlation between ‘unconsidered’ and ‘necessity’ (N = 66, i.e., 33: 23.2% of ‘unconsidered’; 9% of ‘necessity’). Thus, where a respondent voiced feeling unconsidered, they were quite likely to have indicated some sort of ‘necessity’ as the ‘best aspect’ of distance education
Tinto’s model of student dropout can help further situate the Q3 results, insofar as they indicate that ambiguous or negatively correlated respondents may be at higher risk of dropout than those valuing self-determination and flexibility for its own sake. According to Tinto, a number of factors, including a strong commitment to their educational goal and/or institution would be needed to offset the potential negative experience of respondents coded both at ‘flexibility’ and at negative or ‘constraint’ themes. The same could be said for respondents cross-coded at ‘necessity’ or ‘location’, who may be less autonomous learners (Tinto 1975, pp. 92-97). Tinto specifically identifies increased interaction and integration with the institution as vital factors in student persistence. Thus, his model predicts themes such as faculty and peer-group interaction, and social and academic integration (Tinto 1975, p. 95) should clearly emerge in responses to Q4, as was indeed the case.
Q 4 ‘What do you think is the worst aspect of being a distance student?’
Number of responses = 980 (98%), Number of respondents who skipped this question = 22 (2%)
Table 3: Summary of coding Q4
Q4: Worst Aspect |
|||
Codes |
N parent |
N child |
% of total |
ISOLATION: (feeling alone, lack of connection or real time interaction) |
666 |
|
68 |
|
540 |
||
|
126 |
||
BALANCE: (balancing life commitments and study, keeping up, etc.) |
39 |
|
4 |
RESPONSIBILITY: (self-reliance) |
105 |
|
10.7 |
|
|
94 |
|
|
|
9 |
|
RESOURCES: (University resources including lecturers and information - quality, availability or support) |
319 |
|
32.6 |
|
|
140 |
|
|
|
80 |
|
|
|
58 |
|
|
4 |
||
|
37 |
||
UNCONSIDERED: (feeling a lack of consideration or appreciation of distance needs) |
142 |
|
14.5 |
|
24 |
|
|
|
42 |
||
|
57 |
|
|
|
7 |
|
|
|
12 |
||
TRAVEL: (having to go to campus) |
11 |
|
1.1 |
| NOTHING: (generally satisfied) | 22 |
2.2 |
|
 |
|
Figure 2: Code Chart Q4
The largest Q4 node – ‘isolation’ – consisted mostly of responses mentioning lack of connection, interaction, or responsiveness. Primarily these responses referred to interactions with the university itself, rather than to peers or social interaction. There was no significant variation in coding across cohorts, with the exception being students from the education faculty, whose responses coded at ‘isolation’ more than the overall responses coded there (N = 251 (71.1%: i.e., 3.1% more than overall). The predominance of themes of isolation and lack of connection as the ‘worst’ aspect of their experience underscores the importance of Tinto’s ‘academic interaction’ for students’ studying at a distance. It also verifies one of its central hypotheses (touched on above): that the higher the level of social and academic of integration, the more likely a student will persist rather than drop out of their institution. The predominant themes here are also anticipated by Holmberg’s argument that “the stronger the characteristics of guided conversation … [and] students’ feeling that the supporting institution is interested in [their learning] … the stronger the motivation and the more effective the learning” (Holmberg 1989, p. 45).
For Tinto, ‘academic integration’ consists of academic development, educational and institutional commitment, and the “‘person-role’ fit” between a student and the “normative climate” (Tinto 1975, p. 106) of their institution. Social integration, on the other hand, includes social interactions with peers as well as with faculty and other staff members (e.g., administrative). Tinto argues that academic integration is the more important of the two (regarding persistence), but that social interaction with faculty and university staff members in particular also contributes directly to academic integration and increases students’ ‘institutional commitment’ (Tinto 1975, pp. 115 and 109). Responses to Q10 bear this out: The chance to connect with other students (as opposed to staff or support personnel) rated lower here (N (‘very important’) = 458) than ‘approachable people’ (N (‘very important’) = 760). In this light, the emphasis on lack of ‘responsiveness’ and ‘connection’ in Q4 suggests that a significant number of distance students may experience quite low levels of integration with their institution, which, in turn, adds (as hypothesised above) to our understanding of the well documented high level of dropout associated with this cohort on the whole (e.g., Thomson 1997).
Further analysis showed that 37 responses to Q4 were coded at both ‘unconsidered’ and ‘resources’ (8% of total coded at either; 25.7% of ‘unconsidered’), suggesting where students felt ‘unconsidered’, they were also likely to have problems with the resources provided. By comparison, only 6 responses were coded at both ‘unconsidered’ and ‘responsibility’ (2.4% of total coded at either), possibly suggesting that students who struggle with autonomy do not also feel unconsidered (but rather, isolated, as above). 27 (of 58) responses coded at ‘not enough support’ were also coded at ‘isolation’: i.e., 46.6% of those who felt they had ‘not enough support’ also felt isolated.
It should also be noted that the theme of ‘isolation’ itself was strongly associated with the other predominate theme here – ‘resources’. In particular, a single response often (N = 118) mentioned both ‘isolation’ and a perceived difficulty with accessing information, little or lack of resources and support, or some other problem with resources. The high correlations between ‘isolation’ and ‘responsibility’, and ‘isolation and ‘resources’ suggest students who struggle with the degree of autonomy imposed by distance education also struggle with feeling disconnected or with isolation. Similarly, students who struggle with the latter are also likely to struggle with resources (including accessing information, support and technical difficulties).
Given this, and the themes emerging from Q5 and Q14 (discussed below) emphasising ‘more information’, ‘more support’, ‘better/faster responsiveness’, it seems reasonable to postulate that distance students generally want more responsiveness, and more easily accessible, comprehensible content. More speculatively, the data may suggest students’ want less ‘structure’ overall (as Moore’s model predicts). Compare, for example, the 81 responses mentioning some sort of lack of ‘autonomy’ or ‘flexibility’, with the 429 mentioning lack of responsiveness, information, support, or having to take ‘responsibility’ as negative features of distance education.
This is only speculative because, oddly, ‘structure’ is a slippery concept. Moore characterises it as the ‘rigidity or flexibility’ (Moore 2013, p. 70) of a course, and also as the degree of ‘individualisation’ a course allows. But, he takes a ‘self-paced’ course to typify both a ‘non-individualised’ (Moore 1973, p. 666) and a ‘highly responsive’ [more able to be ‘individualised’] course (Moore 2013, p. 70). Perhaps then, the survey responses here give us further reason to suspect that the concept of ‘structure’ is more complex than it first appears (more than they may indicate a preference for low structure). And so too, that the role of ‘structure’ in determining ‘transactional distance’ is perhaps not as simple as Moore portrays.
On the whole, responses mentioned self-pacing in the context of time or consideration/accommodation. This suggests that it is not lack of flexibility in structure (e.g., courses or content not adapted to individual learners’ needs) that is impacting negatively on students’ experience, but rather in time (Q10 is again relevant here, identifying ‘a wide range of times’ (N = 599) as ‘very important’ for high quality online service).
Indeed, the features of courses that emerged as desirable for students (inferred from features students experience as frustrating, of low quality, or inadequate) appear generally to have ‘high’ structure, e.g., expectations, goals, and content that are determinate, orderly, and clearly communicated. Note the following selected responses: “not having a structure for study time and having to self-regulate”. “not … get[ting] the whole picture and understanding of exactly what each individual lecturer wants”, “no one to guide”, and “poorly organized … experiences”. The impression these responses give, and the general impression of the author on analysing all responses, was that students seek something akin to Moore’s original description of a typical distance course; i.e., ’carefully prepared, with the teacher’s aims and intentions unambiguously stated … materials well-devised, well-illustrated, and appropriately paced” (Moore 1973, p. 671).
But this may mean that (at least in some respects) students experience highly structured courses more positively (in particular as less isolating) than they do courses with low structure. Perhaps the three dominant themes of Q4 can best be understood via a distinction between self-paced (flexible time, consideration, etc.) and self-taught (independent learning, teachers as consultants rather than guides, etc.). The dominant themes then suggest that students want the former but not the latter (evidenced, for example, by calls for increased lecturer feedback, clearly delineated information, etc.). This distinction also helps make sense of the dominant themes of Q4 and Q14.
In sum, while these results do confirm a relationship between structure and what Moore calls ‘dialogue’, they also suggest its effect could be more complex than simply increasing or decreasing transactional distance (for more on the complexity of the ‘structure’ concept and its relationship to autonomy, see Holmberg 1989, pp. 154-160). For instance, it could be that non-autonomous learners may need high levels of both structure and dialogue. The role and importance of the latter, though, was unequivocally confirmed by the results for Q5 and Q14, which we turn to next.
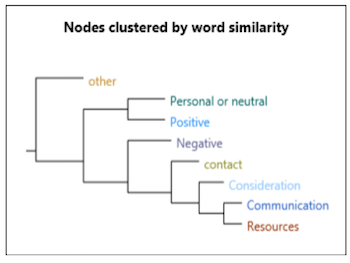
Q 5 ‘What would make distance learning better for you?’
Number of responses = 887 (88.5%) Number of respondents who skipped this question 115 (11.5%)
Table 4: Summary of coding Q5
Q5: Making it Better |
|||
Codes |
N parent |
N child |
% of total |
CONTACT: (all appeals for more contact, synchronous, physical) |
282 |
|
31.8 |
|
206 |
||
|
72 |
||
|
4 |
||
CONSIDERATION: (appeals for consideration of peculiarly distance or online needs and circumstances) |
105 |
|
11.8 |
|
|
24 |
|
|
63 |
||
|
18 |
||
| COMMUNICATION: (clearer, more or better responsiveness, communication or information) | 153 |
17.2 |
|
RESOURCES: (better: support, online resources, offline resources, tech, library, teaching) |
312 |
|
35.2 |
|
|
258 |
|
|
|
28 |
|
|
|
5 |
|
|
|
21 |
|
NEGATIVE |
13 |
|
1.5 |
|
4 |
||
|
9 |
||
| POSITIVE | 46 |
5.2 |
|
|
40 |
||
|
6 |
||
PERSONAL OR NEUTRAL |
100 |
|
11.3 |
|
|
59 |
|
|
|
41 |
|
| OTHER | 20 |
2.3 |
|
 |
|
Figure 3: Code Chart Q5
Q14 – any other comments on support
Number of responses = 318 (31.7%), Number of respondents who skipped this question = 684 (68.3%)
Table 5: Summary of Coding Q14
Q14: Other Comments |
|||
Codes |
N parent |
N child |
% of total |
LIVE: (mention of live synchronous connection) |
18 |
|
5.7 |
| APPEAL: (appeal or suggestion) | 149 |
46.9 |
|
|
30 |
||
|
5 |
||
|
42 |
||
|
|
7 |
|
|
17 |
||
|
23 |
||
|
12 |
||
|
7 |
||
|
2 |
||
|
4 |
||
| SPECIFIC: (specific, isolated or personal experience, or mention of one incident or person) | 4 |
1.3 |
|
| POSITIVE | 105 |
33 |
|
|
|
34 |
|
|
30 |
||
|
16 |
||
|
25 |
||
| NEGATIVE | 160 |
50.3 |
|
|
|
13 |
|
|
15 |
||
|
5 |
||
|
30 |
||
|
22 |
||
|
18 |
||
|
13 |
||
|
44 |
||
| NEUTRAL | 9 |
2.8 |
|
|
5 |
||
|
4 |
||
| PHYSICAL: (mention of physical (‘in person’) contact or physical face to face) | 12 |
||
 |
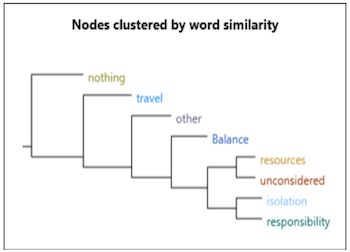
|
Figure 4: Word similarity and shared coding on main theme Q14
For Moore, more ‘dialogue’ means less transactional distance (where ‘dialogue’ is defined as ‘constructive’ and ‘synergistic’ interchange in which “each party … is a respectful and active listener” (Moore 2013, p.70, quoting Moore 1993, p. 26) and increasing dialogue is a key element in increasing the success of less autonomous learners (Moore 2013, p. 73). Holmberg more specifically theorises that friendly, conversational language, both in material and in dialogue, enhances learning. He goes on to contend that this ‘conversation concept’ (Holmberg 1989, p. 43) is as applicable to distance as to face-to-face contexts (Holmberg 1989, pp. 160-4).
The responses here support both of these theories. Communication and contact taken together form a predominant key theme (N = 435). Although correlation between codes was not particularly high, codes sharing the highest correlation with ‘contact’ were ‘communication and ‘consideration’. This confirms Holmberg’s theory in particular, suggesting common factors underpinning the concept of ‘contact’ and feeling considered, as well as feeling that lines of communication are open. Also of note in this respect was that ‘physical’ at Q14 was a relatively small code (N = 12).
Nonetheless, it’s worth noting that most respondents whose suggestions for improvement included explicit mention of physical or ‘in-person’ contact had also attempted to access a student service in the past. This may counter Holmberg’s contention somewhat, in that it may support the presence of a positive correlation between engagement and physical connection, but such a correlation runs counter to a host of other research besides Holmberg’s equally supporting the effectiveness of a feeling of connection in the distance mode (e.g., Herman and Banister, 2007; Ellis, 2011). A more significant finding here may be the correlation between appeals for ‘interaction and greater responsiveness’ and attempts to access services. A query run on the correlation between accessing services and sub codes capturing these elements (in Q14) supports the supposition of a correlation between respondents naming ‘connection’ and ‘responsiveness’ as key factors for improvement, and their engagement (as reflected by accessing services).
Moore’s hypothesis that “highly autonomous learners are able to cope with a lower degree of dialogue but less autonomous need a relatively high degree of dialogue [and] … programs [with high dialogue are] … more attractive to those learners who are less secure in managing their own learning. On the other hand, more autonomous learners are more comfortable with less dialogue.” (Moore, 2013, pp. 71, 73). Applying these hypotheses to the results here confirms our earlier postulation of an increase (over time) in the number of non-autonomous learners undertaking distance education.
But the dominance of ‘resources’ in the ‘negative’ node for Q14 and of the overall call to ‘improve resources’ in Q5, suggests that the distinction between self-paced and self-taught outlined above applies here as well. ‘Responsiveness’, ‘consideration’, and ‘support’ are desirable features of staff toward students (i.e., features of teaching), rather than of the structure of the course or of the material itself. Equally, ‘flexibility’ was mentioned with respect to life/work/time constraints: i.e., to ‘consideration’, ‘arrangements’ and ‘needs’, rather than to learning per se.
Perhaps the primary significance of this research is as a ground informing further research directions: by indicating directions that matter to students themselves. The large sample and wide open questions offer rich insight into students’ experience, concerns and attitudes regarding distance education. Of course, given the large sample, there’s more work to be done assimilating the data and drawing meaningful conclusions from its analysis. But the research done already contributes to the understanding of distance education afforded by the existing theoretical frameworks discussed above by providing a picture of emergent concepts that is more finely differentiated, nuanced and complex than they currently reflect by revealing complexity in the concepts of ‘structure’ and ‘flexibility’. Further, the focus on student experience from the student perspective both updates and adds another dimension to such theories by noting shifts in the relevance of ‘autonomy’ over time and bringing the student voice to bear on key hypotheses.
In the immediate future, follow-up research will seek to further ramify analysis of the strongest emergent themes: ‘isolation’ and ‘contact’. Empirical research will explore the possible factors constituting these concepts themselves (i.e., both in a distance-educational context and an on-campus or ‘in person’-educational context) and these concepts, both as they are manifest and are experienced in distance environments. To this end, the construction of a follow up theory-driven survey is currently underway. The follow-up survey is designed for factor analysis on core features of distance study suggested by actual student responses. These responses are grouped according to degree of correlation with other codes, e.g., question content is drawn from a cross section of responses from strongly correlated codes.
For example, one question the follow-up survey asks is: ‘What does isolation mean to you?’
The Likert-style exploration of this concept is based on actual student responses, including:
Elements contributing to isolation will be explored via a similar treatment of the question: ‘what makes you feel isolated? As with elements constituting the concept ‘connection’ (‘what does connection mean to you?’), and elements contributing to connection (‘what makes you feel connected?’).
Follow-up theoretical research includes a close examination of previous research on core concepts and related concepts, e.g., on ‘presence’ and ‘belonging’ (Jézégou, 2012, Tu, 2002, Turkle, 2011, Mahony & Morgan, 1991). For example, if we consider a sense of personal connection to be the counter-point of an experience of isolation, then how distance students experience both of these states needs careful examination (as does the experience of on-campus students, to identify any commonalities between the two). It is also important to keep in mind that the extent to which a distance or fully online student can feel a personal connection may or may not be limited by their reliance on ‘technologically mediated communication’ (TMC) (Caughlin & Sharabi, 2013, p. 877). For example, a full experience of connection may involve elements that extend beyond TMC, to the extent that: “relational closeness is linked to multiple modes of communication” (Caughlin & Sharabi 2013, p. 877 referring to Reminrez & Broneck, 2009).
Finally, it is worth noting that all three of the main themes for Q5: ‘contact’ ‘consideration’ and ‘communication’ are strongly associated with the concept ‘connection’ and all clearly run counter to ‘isolation’. This serves to confirm the identification of the latter two as the principal core concepts deserving further theoretical analysis and empirical investigation. Completed theoretical work includes the construction of a new theoretical framework attending to the complexity of these core concepts and taking into account the ubiquity, nature, impact and effectiveness of the delivery of distance education online (Rush, 2015).
1. Some of this remains outstanding, although most has been completed. Of the latter, some was deemed likely to be of internal interest only (e.g., a precise breakdown of the university’s resource types mentioned in the above).
2. With the exception of Qs 12 and 13, which were left with the number of codes capturing each service accessed and each general reported experience type.
3. Summary results for ‘narrow context’ questions:
Q 6: Number of responses = 997 (99.5%), Number of respondents who skipped this question = 5 (.5%). Most students ‘strongly agreed’ or ‘agreed’ (N = 430 and 427 respectively). Other results were: ‘neutral’ (N = 87), ‘disagree’ (N = 43) and ‘strongly disagree’ (N-10)
Q7: Number of responses = 998 (99.6%) Number of respondents who skipped this question = 4 (.4%). ‘Faculty based advice’ was most likely to be accessed (N (‘likely’ and ‘very likely’) = 563), with ‘migrant’ and ‘international’ advice begin least likely (N for each question respectively (‘unlikely’ and ‘very unlikely’) = 822, 810). This is probably a direct reflection of the demographics of the group, which needs further research.
Q 8: Number of responses = 997 (99.5%), Number of respondents who skipped this question = 5 (.5%). The most likely academic skill services to be utilised were ‘research skills’ (N (‘likely’ and ‘very likely’) = 660) and ‘essay writing’ (N (‘likely’ and ‘very likely’ = 629). ‘Targeted Science, Engineering or Mathematics skills’ were least likely (N (unlikely’ and ‘very unlikely’) = 461), which again, is probably a reflection of the demographic – only a small number of respondents came from SET faculties.
Q 9: Number of responses =993 (99.1%) Number of respondents who skipped this question = 9 (.9%). social media did not rate highly here (N (‘unlikely’ and ‘very unlikely’ = 422), and email did (N (‘likely’ and ‘very likely’) = 874) – this apparently counters current thinking on the prevalence and popularity of use of the former over the latter, and deserves further investigation.
Q 10: The highest rated category here was accessibility of technology (N (‘very important’= 806), which is a well understood and fairly obvious factor. Also rating highly were ‘approachable people’ (N (‘very important’) = 760) and ‘a wide range of times’ (N (‘very important’) = 599), which underscores the key themes of ‘flexibility’, ‘contact’ and ‘isolation’. Note that the chance to connect with other students (as opposed to staff or support personnel) rated (relatively) lowly here (N (‘very important’) = 458) – again, suggesting this as an area for further investigation.
Q 11: yes 32.3% (N= 320); no 67.7% (N=672)
Q 12: Number of responses = 313 (31.2%), Number of respondents who skipped this question = 689 (68.8%). Services or advice most commonly accessed = ‘tech help including webmail’ (N = 45), least commonly accessed (aside from ‘unspecified’) = ‘course advice’ (N = 28).
Q 13: Number of responses = 313 (31%), Number of respondents who skipped this question = 689 (69%). The largest node here was ‘useful or helpful’ (N = 111 (35%)), and the smallest was ‘no help at all’ (N = 2 (.64%).
Penny Rush, University of Tasmania. E-mail: penelope.rush@utas.edu.au